Technical Analysis of NGD 2024-05-10
Overview:
In analyzing the technical indicators for NGD over the last 5 days, we will delve into the trend, momentum, volatility, and volume indicators to provide a comprehensive outlook on the possible stock price movement. By examining these key factors, we aim to offer valuable insights and predictions for the upcoming trading days.
Trend Analysis:
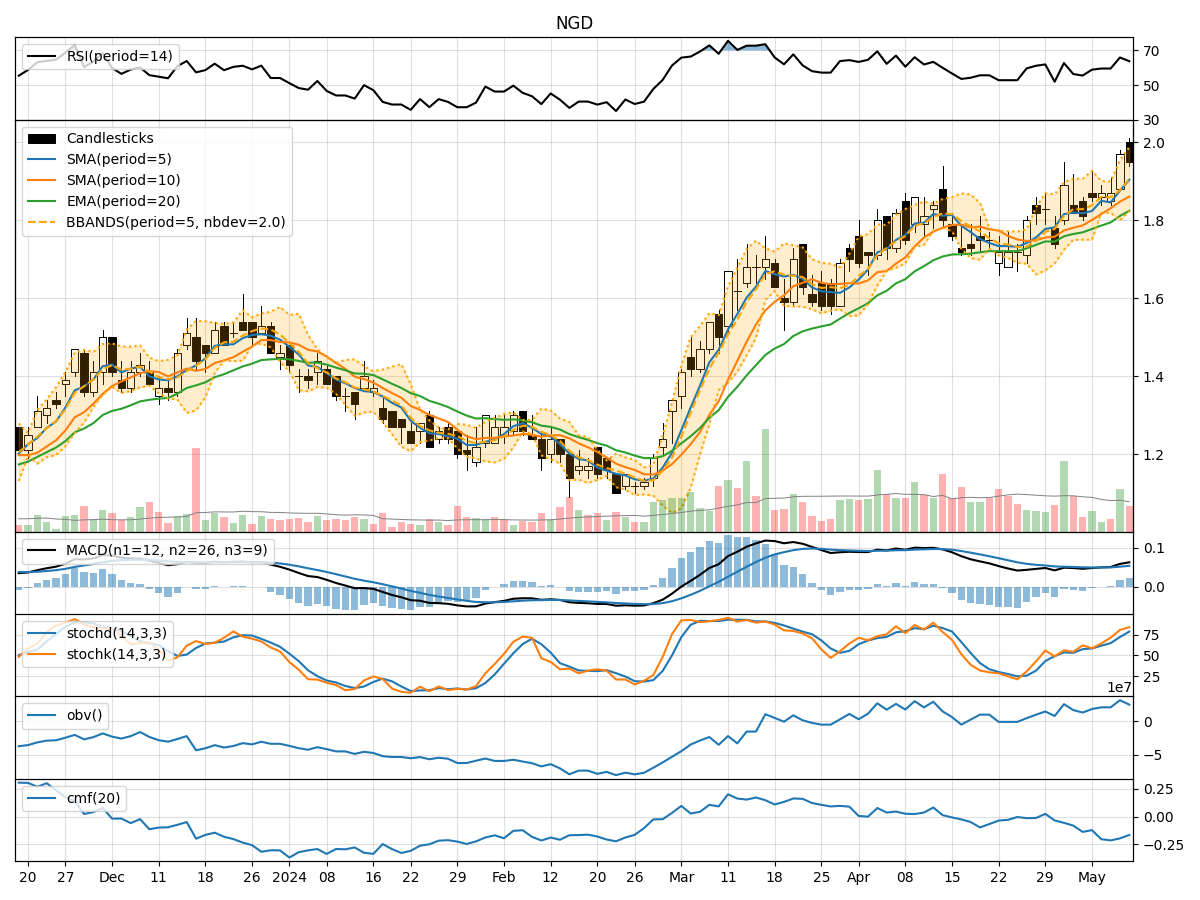
- Moving Averages (MA): The 5-day MA has been consistently rising, indicating a bullish trend in the short term.
- MACD: The MACD line has been above the signal line, suggesting positive momentum in the stock price.
- EMA: The exponential moving average has also been trending upwards, supporting the bullish sentiment.
Momentum Analysis:
- RSI: The Relative Strength Index has been in the overbought territory, indicating a potential reversal or consolidation.
- Stochastic Oscillator: Both %K and %D have been in the overbought zone, signaling a possible pullback.
- Williams %R: The indicator has been fluctuating but recently moved out of the oversold region, hinting at a shift in momentum.
Volatility Analysis:
- Bollinger Bands: The stock price has been trading within the bands, with the upper band acting as a resistance level.
- Bollinger %B: The %B indicator has been fluctuating, suggesting potential price reversals or breakouts.
Volume Analysis:
- On-Balance Volume (OBV): The OBV has been relatively stable, indicating a balance between buying and selling pressure.
- Chaikin Money Flow (CMF): The CMF has been negative, reflecting a lack of strong buying interest in the stock.
Key Observations:
- The trend indicators point towards a bullish sentiment in the short term.
- Momentum indicators suggest a potential reversal or consolidation due to overbought conditions.
- Volatility indicators show a range-bound trading pattern with resistance at the upper Bollinger Band.
- Volume indicators indicate a neutral stance with no significant accumulation or distribution signals.
Conclusion:
Based on the analysis of the technical indicators, the next few days' possible stock price movement for NGD is likely to experience a short-term consolidation or pullback. The overbought conditions in the momentum indicators and the resistance at the upper Bollinger Band signal a potential pause in the bullish trend. Traders should exercise caution and consider waiting for a clearer signal before making trading decisions.