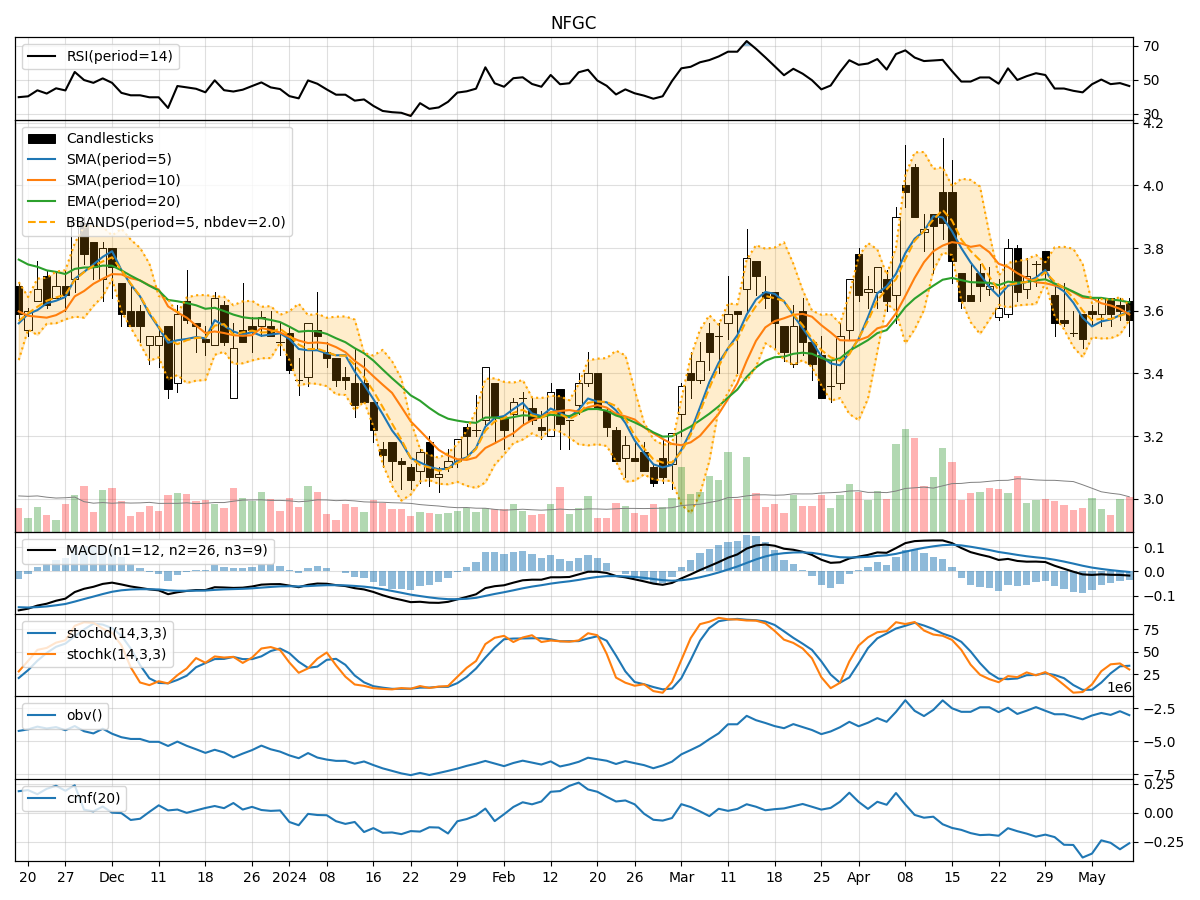
Technical Analysis of NFGC 2024-05-10
Overview:
In analyzing the technical indicators for NFGC over the last 5 days, we will delve into the trend, momentum, volatility, and volume indicators to provide a comprehensive outlook on the possible stock price movement in the coming days. By examining these key indicators, we aim to offer valuable insights and predictions to guide your investment decisions.
Trend Analysis:
- Moving Averages (MA): The 5-day MA has been fluctuating around the closing prices, indicating short-term price trends. The SMA(10) and EMA(20) have been gradually declining, suggesting a bearish trend.
- MACD: The MACD line has been consistently negative, with the MACD histogram also showing a downward trend. This indicates a bearish momentum in the stock price.
- Conclusion: The trend indicators point towards a bearish outlook for NFGC in the near term.
Momentum Analysis:
- RSI: The RSI has been hovering around the neutral zone, indicating a lack of strong momentum in either direction.
- Stochastic Oscillator: Both %K and %D have been fluctuating, but generally staying below the overbought threshold, suggesting a lack of strong buying momentum.
- Conclusion: The momentum indicators suggest a neutral stance with no clear direction in the stock's momentum.
Volatility Analysis:
- Bollinger Bands: The stock price has been trading within the bands, with the %B indicator showing fluctuations but not indicating any extreme conditions.
- Conclusion: Volatility remains relatively stable, with the stock price likely to continue trading within the current range without significant breakout potential.
Volume Analysis:
- On-Balance Volume (OBV): The OBV has been fluctuating, indicating mixed buying and selling pressure.
- Chaikin Money Flow (CMF): The CMF has been negative, suggesting a net outflow of money from the stock.
- Conclusion: Volume indicators reflect a mixed sentiment with no clear dominance of buying or selling pressure.
Overall Conclusion:
Based on the analysis of trend, momentum, volatility, and volume indicators, the overall outlook for NFGC in the next few days is bearish. The trend indicators signal a downward trajectory, while momentum remains neutral with a slight bearish bias. Volatility is stable, indicating a lack of significant price movements, and volume indicators show mixed signals without a clear direction.
Recommendation:
Considering the bearish trend and mixed momentum and volume signals, it is advisable to exercise caution when trading NFGC in the coming days. Traders may consider short-term bearish strategies or wait for more clarity in the market before taking significant positions. Monitoring key support levels and potential reversal patterns can help in making informed trading decisions.
Disclaimer:
Remember that technical analysis is not foolproof and market conditions can change rapidly. It is essential to combine technical analysis with fundamental research and risk management strategies to make well-informed investment decisions. Consulting with a financial advisor or conducting further analysis based on real-time data is recommended before making any trading decisions.