Technical Analysis of MTA 2024-05-10
Overview:
In analyzing the provided MTA TA data for the last 5 days, we will delve into the technical indicators across trend, momentum, volatility, and volume to derive insights into the possible future stock price movement. By examining these indicators comprehensively, we aim to provide a well-informed prediction backed by data-driven analysis and expert interpretation.
Trend Analysis:
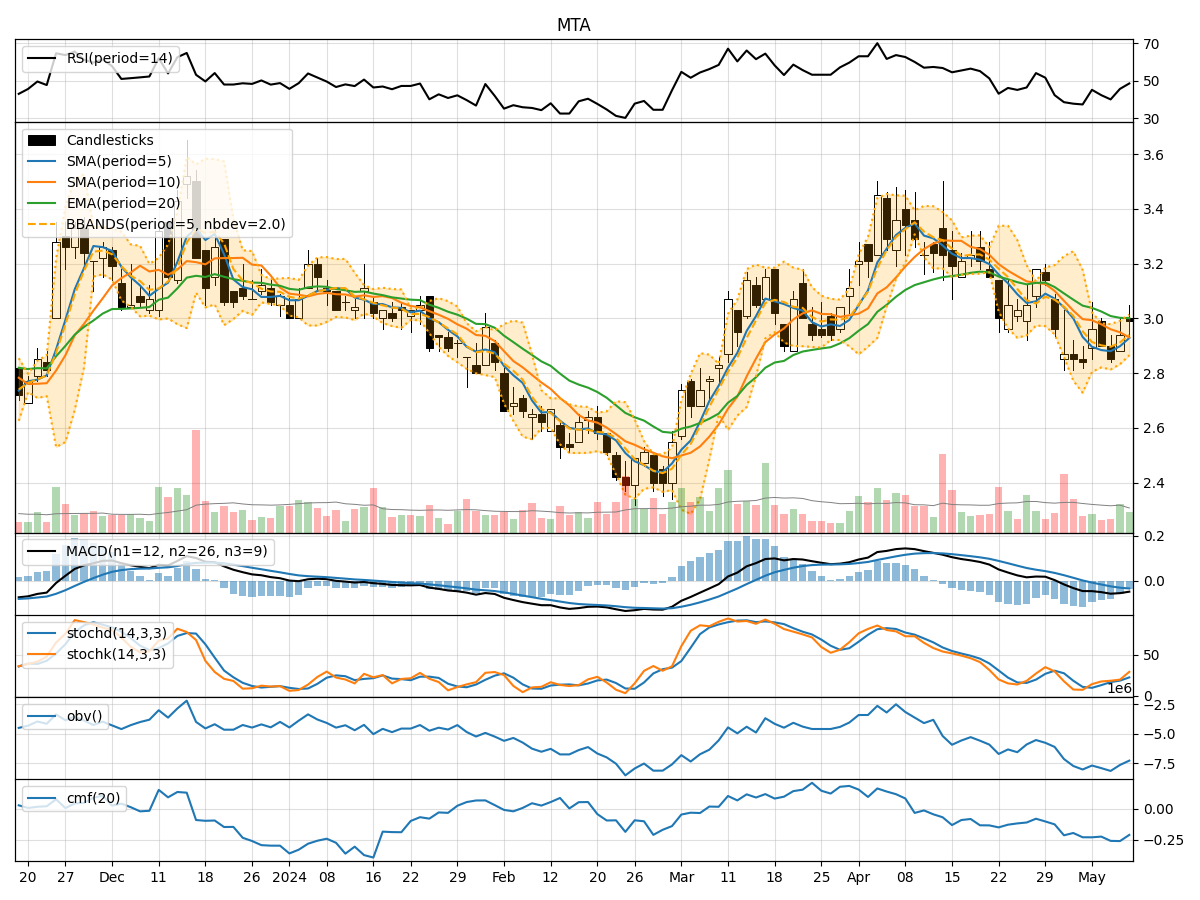
- Moving Averages (MA): The 5-day MA has been fluctuating around the closing prices, indicating short-term price trends. The SMA(10) and EMA(20) show a downward trend, suggesting a bearish sentiment in the medium to long term.
- MACD: The MACD line has been consistently negative, with the MACD histogram also in the negative territory. This indicates a bearish trend in the stock price momentum.
Momentum Analysis:
- RSI: The RSI values have been relatively low, indicating a lack of strong momentum in either direction.
- Stochastic Oscillator: Both %K and %D values have been below 20, suggesting an oversold condition in the stock.
- Williams %R: The Williams %R values have been fluctuating around -50, indicating a neutral momentum.
Volatility Analysis:
- Bollinger Bands (BB): The stock price has been trading within the lower Bollinger Band, suggesting a potential oversold condition.
- Bollinger %B: The %B values have been below 1, indicating a potential buying opportunity as the stock price is trading below the lower band.
Volume Analysis:
- On-Balance Volume (OBV): The OBV values have been negative, indicating a net selling pressure in the stock.
- Chaikin Money Flow (CMF): The CMF values have been consistently negative, suggesting a bearish sentiment in the stock.
Key Observations:
- The stock is currently in a bearish trend based on moving averages and MACD analysis.
- Momentum indicators suggest a lack of strong directional momentum.
- Volatility indicators point towards a potential oversold condition.
- Volume indicators indicate a prevailing selling pressure in the stock.
Conclusion:
Based on the analysis of the technical indicators, the stock is likely to experience further downward movement in the next few days. The bearish trend indicated by moving averages and MACD, coupled with the oversold condition highlighted by volatility indicators, suggests a continuation of the current downward trajectory. Traders and investors should exercise caution and consider shorting or staying away from long positions until a clear reversal pattern emerges.