Technical Analysis of ITP 2024-05-10
Overview:
In analyzing the technical indicators for ITP over the last 5 days, we will delve into the trend, momentum, volatility, and volume indicators to provide a comprehensive outlook on the possible stock price movement in the coming days.
Trend Analysis:
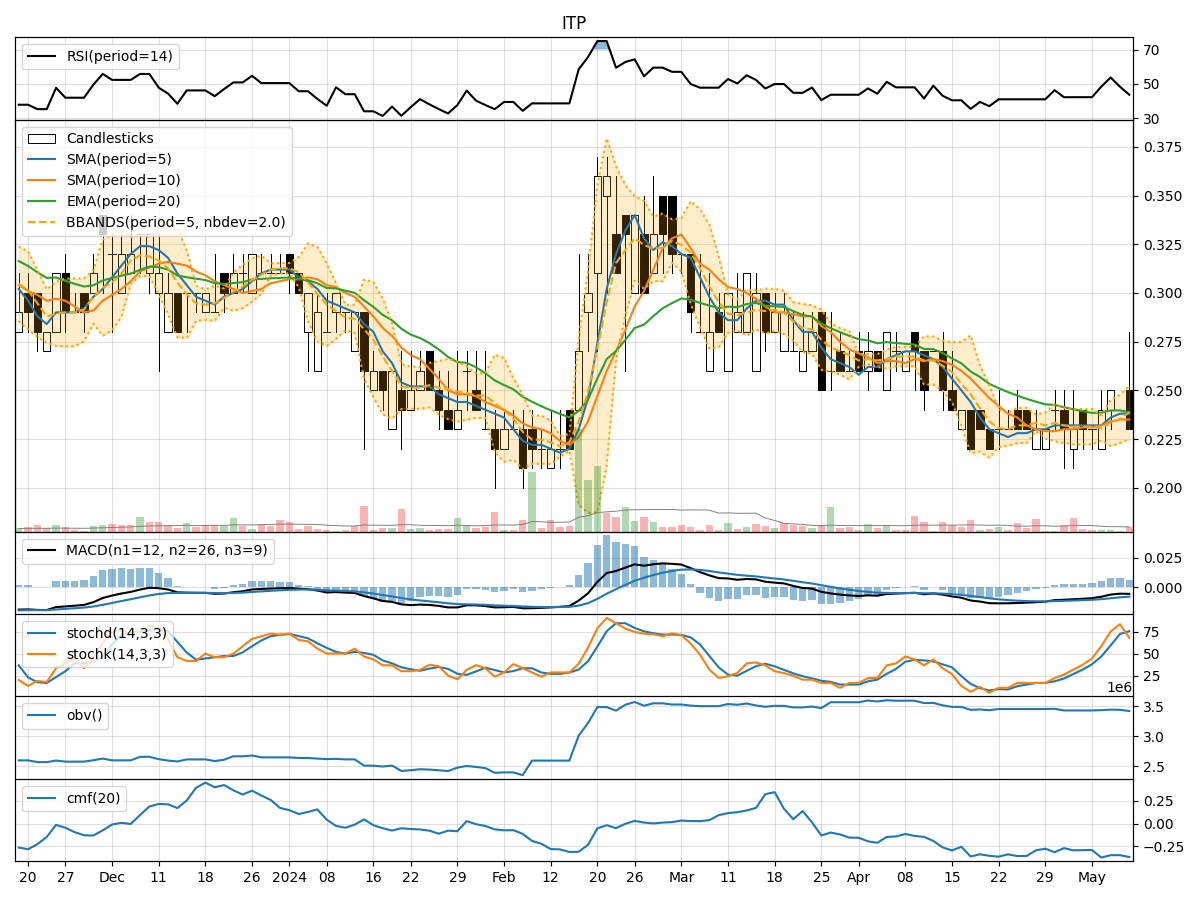
- Moving Averages (MA): The 5-day Moving Average (MA) has been relatively stable around $0.23 to $0.24, indicating a sideways trend.
- MACD: The Moving Average Convergence Divergence (MACD) has been consistently negative, suggesting a bearish trend.
- EMA: The Exponential Moving Average (EMA) has shown a slight decline, aligning with the bearish sentiment.
Momentum Analysis:
- RSI: The Relative Strength Index (RSI) has been fluctuating around the neutral zone, indicating indecision in the market.
- Stochastic Oscillator: Both %K and %D have shown mixed signals, with %K crossing %D, suggesting potential reversal points.
- Williams %R: The Williams %R has been in oversold territory, signaling a possible buying opportunity.
Volatility Analysis:
- Bollinger Bands (BB): The Bollinger Bands have narrowed, indicating decreased volatility and a potential breakout in the near future.
- BB %B: The %B indicator has been hovering around the middle band, reflecting a balanced market sentiment.
Volume Analysis:
- On-Balance Volume (OBV): The OBV has shown a slight decrease, suggesting some distribution in the stock.
- Chaikin Money Flow (CMF): The CMF has been negative, indicating selling pressure in the market.
Key Observations:
- The trend indicators suggest a bearish sentiment with a sideways movement in prices.
- Momentum indicators show mixed signals, indicating a lack of clear direction in the market.
- Volatility has decreased, hinting at a potential breakout or consolidation phase.
- Volume indicators point towards some selling pressure and distribution.
Conclusion:
Based on the analysis of the technical indicators, the stock price of ITP is likely to experience further downward movement in the coming days. The bearish trend indicated by the MACD and EMA, coupled with the mixed signals from momentum indicators and selling pressure shown in volume indicators, suggest a bearish outlook. Traders should exercise caution and consider short-term selling opportunities or wait for a clearer trend to emerge before making any significant investment decisions.