Technical Analysis of IMO 2024-05-10
Overview:
In analyzing the technical indicators for the stock IMO over the last 5 days, we will delve into the trends, momentum, volatility, and volume indicators to provide a comprehensive outlook on the possible stock price movement in the coming days. By examining these key indicators, we aim to offer valuable insights and predictions to guide investment decisions.
Trend Indicators:
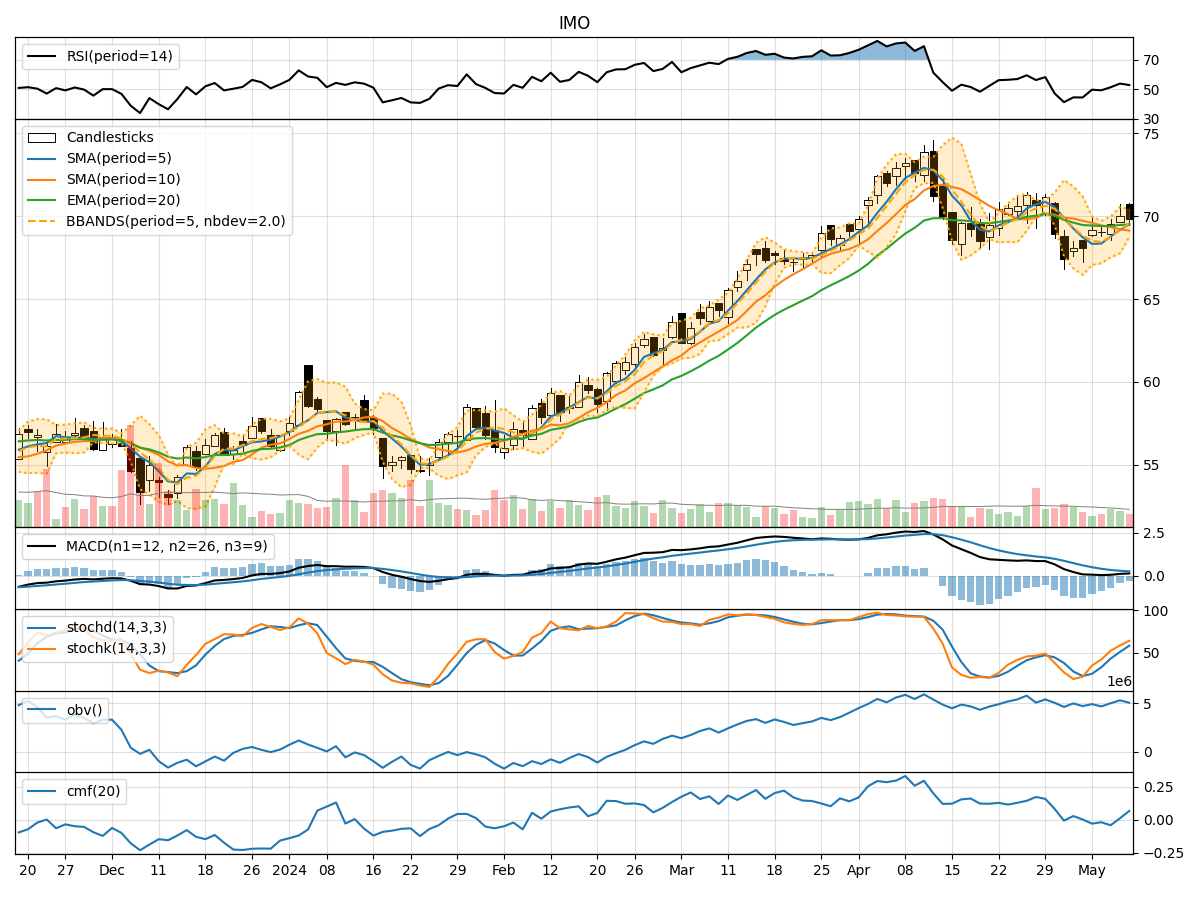
- Moving Averages (MA): The 5-day Moving Average (MA) has been gradually increasing, indicating a positive trend in the stock price.
- MACD: The MACD line has been consistently above the signal line, suggesting bullish momentum in the stock.
- EMA: The Exponential Moving Average (EMA) has also been on an upward trajectory, supporting the bullish sentiment.
Momentum Indicators:
- RSI: The Relative Strength Index (RSI) has been hovering around the mid-level, indicating a neutral stance in momentum.
- Stochastic Oscillator: Both %K and %D have been rising, reflecting increasing buying pressure.
- Williams %R: The Williams %R is in the oversold territory, suggesting a potential reversal in the stock price.
Volatility Indicators:
- Bollinger Bands: The Bollinger Bands have been narrowing, indicating decreasing volatility in the stock.
- Bollinger %B: The %B indicator is below 1, suggesting the stock is trading below the upper Bollinger Band.
Volume Indicators:
- On-Balance Volume (OBV): The OBV has shown mixed signals, fluctuating over the last 5 days.
- Chaikin Money Flow (CMF): The CMF has been negative, indicating selling pressure in the stock.
Key Observations:
- The trend indicators suggest a bullish sentiment with increasing moving averages and positive MACD.
- Momentum indicators show a mixed picture with RSI neutral, Stochastic Oscillator rising, and Williams %R in oversold territory.
- Volatility indicators point towards decreasing volatility in the stock.
- Volume indicators reflect mixed signals with OBV fluctuating and CMF indicating selling pressure.
Conclusion:
Based on the analysis of the technical indicators, the stock IMO is likely to experience further upward movement in the coming days. The bullish trend supported by moving averages and MACD, along with the potential reversal indicated by Williams %R, suggests a positive outlook. However, investors should remain cautious of the mixed signals in momentum and volume indicators. Overall, the stock is poised for upward momentum in the near term.