Technical Analysis of GTE 2024-05-10
Overview:
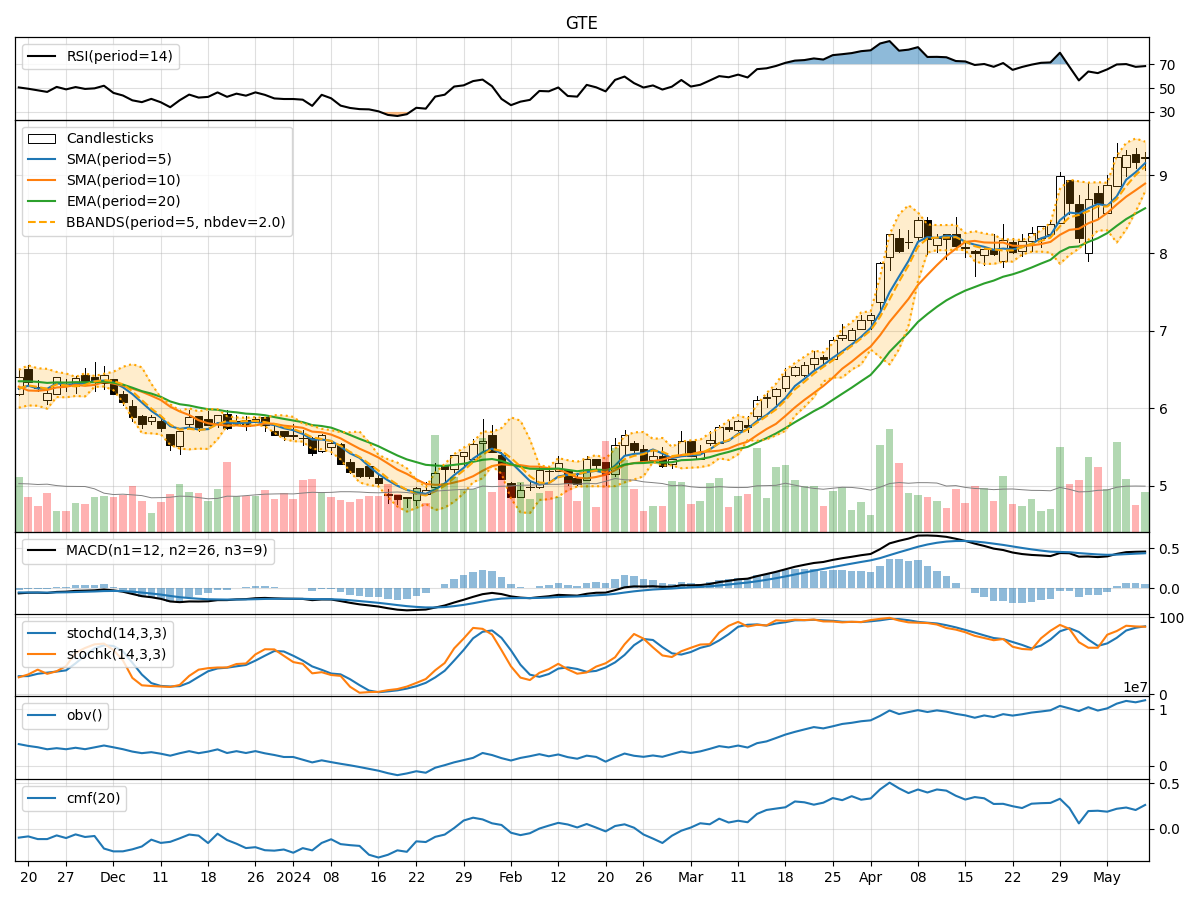
In the last 5 trading days, GTE stock has shown a consistent uptrend in its price, supported by increasing volumes. The moving averages and MACD indicators also suggest a positive momentum. However, the stock is currently trading near its upper Bollinger Band, indicating potential overbought conditions. The RSI and Stochastic indicators are in the overbought territory, signaling a possible reversal or consolidation.
Trend Analysis:
- Moving Averages (MA): The 5-day moving average has been consistently above the 10-day simple moving average, indicating a short-term bullish trend.
- MACD: The MACD line has been above the signal line, showing positive momentum in the stock price.
Key Observation: The stock is in a short-term uptrend, but caution is advised as it may be overextended.
Momentum Analysis:
- RSI: The RSI has been in the overbought zone, suggesting a potential reversal or consolidation.
- Stochastic Oscillator: Both %K and %D are in the overbought region, indicating a possible weakening of the current uptrend.
Key Observation: Momentum indicators are signaling a potential pullback or consolidation in the stock price.
Volatility Analysis:
- Bollinger Bands: The stock price is currently near the upper Bollinger Band, indicating potential overbought conditions.
- Bollinger %B: The %B is above 0.8, suggesting the stock is trading at the upper end of its recent price range.
Key Observation: Volatility indicators suggest caution as the stock may be overbought and due for a correction.
Volume Analysis:
- On-Balance Volume (OBV): The OBV has been increasing, indicating strong buying pressure in the stock.
- Chaikin Money Flow (CMF): The CMF is positive, reflecting buying interest over the past 20 days.
Key Observation: Volume indicators support the current uptrend in the stock price.
Conclusion:
Based on the technical indicators and analysis: - Short-Term View: The stock may experience a pullback or consolidation in the coming days due to overbought conditions indicated by momentum and volatility indicators. - Long-Term View: The overall trend remains bullish, supported by strong buying volumes and positive moving averages.
Recommendation: Consider taking profits or tightening stop-loss levels to manage potential downside risk. Monitor for signs of a reversal or consolidation before considering new long positions.
Always remember to conduct further research and consider fundamental factors before making investment decisions.