Technical Analysis of GRFX 2024-05-10
Overview:
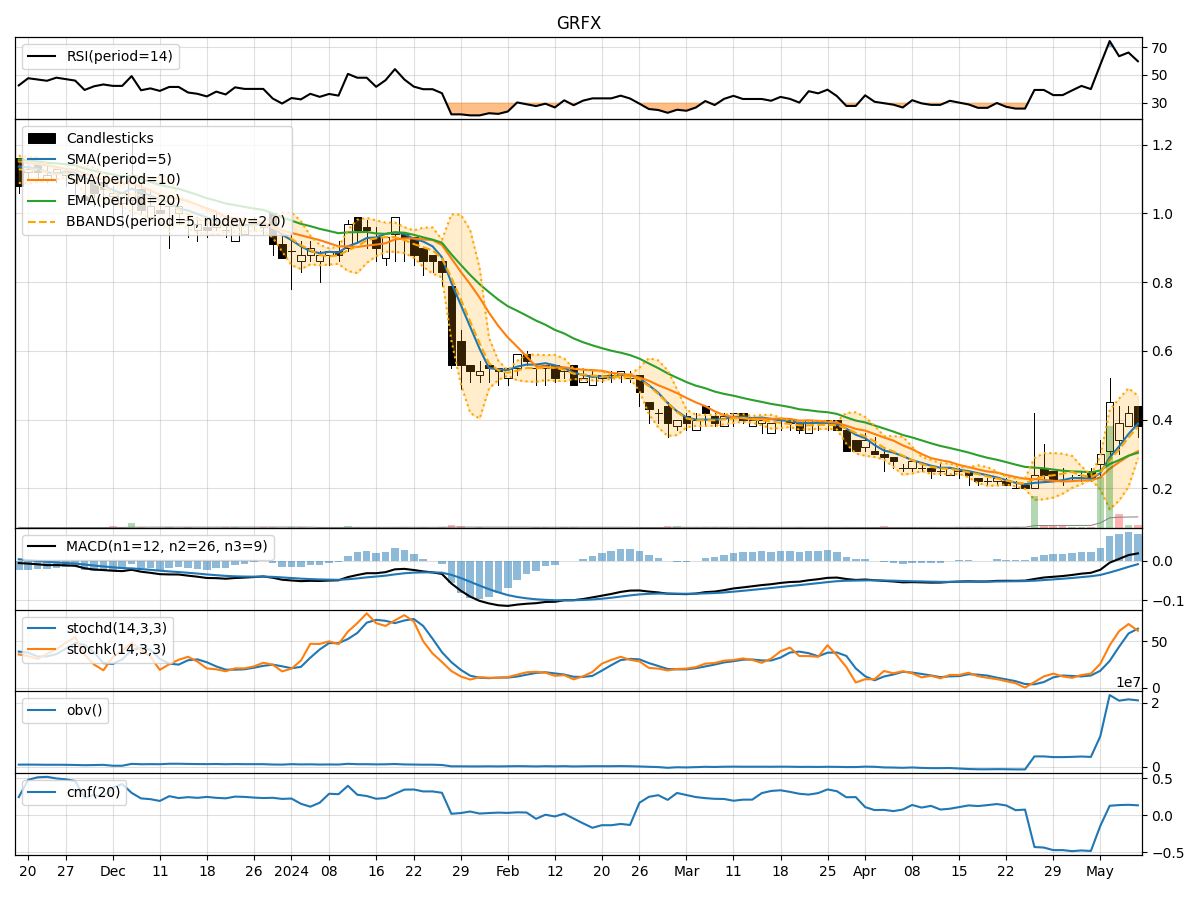
In analyzing the technical indicators for GRFX over the last 5 days, we will delve into the trend, momentum, volatility, and volume indicators to provide a comprehensive assessment of the stock's potential price movement. By examining these key factors, we aim to offer valuable insights and predictions for the next few days.
Trend Analysis:
- Moving Averages (MA): The 5-day Moving Average (MA) has been consistently increasing, indicating a bullish trend in the short term.
- MACD: The MACD line has been positive and rising, suggesting upward momentum in the stock price.
- EMA: The Exponential Moving Average (EMA) has been trending upwards, supporting the bullish sentiment.
Key Observation: The trend indicators point towards a bullish outlook for GRFX.
Momentum Analysis:
- RSI: The Relative Strength Index (RSI) has been fluctuating but generally staying within the neutral range, indicating a balanced momentum.
- Stochastic Oscillator: Both %K and %D have been in the overbought territory, suggesting a potential reversal or consolidation.
- Williams %R: The Williams %R is in the oversold region, indicating a possible buying opportunity.
Key Observation: The momentum indicators signal a mixed sentiment with a slight bearish bias.
Volatility Analysis:
- Bollinger Bands (BB): The Bollinger Bands have widened, indicating increased volatility in the stock price.
- BB %B: The %B is below 1, suggesting the stock is trading below the lower Bollinger Band, potentially indicating an oversold condition.
Key Observation: Volatility has increased, and the stock may be oversold, potentially leading to a reversal or consolidation.
Volume Analysis:
- On-Balance Volume (OBV): The OBV has been fluctuating but has not shown a clear trend, indicating mixed buying and selling pressure.
- Chaikin Money Flow (CMF): The CMF has been positive, suggesting a net inflow of money into the stock.
Key Observation: Volume indicators suggest mixed sentiment with a slight bullish bias.
Conclusion:
Based on the analysis of trend, momentum, volatility, and volume indicators, the next few days for GRFX could see increased volatility with a potential for reversal or consolidation in the stock price. While the trend indicators point towards a bullish outlook, the momentum indicators signal a mixed sentiment with a slight bearish bias. Therefore, it is crucial for investors to closely monitor the stock's price action and key levels to make informed trading decisions.
Recommendation:
- Short-term Traders: Consider taking profits or setting tight stop-loss orders due to the mixed momentum signals.
- Long-term Investors: Monitor the stock closely for potential entry points during consolidation or reversal patterns.
In conclusion, while the overall trend is bullish, the mixed signals from momentum indicators and increased volatility suggest a cautious approach in the coming days.