Technical Analysis of GENC 2024-05-31
Overview:
In analyzing the technical indicators for GENC over the last 5 days, we will delve into the trend, momentum, volatility, and volume indicators to provide a comprehensive outlook on the possible stock price movement in the coming days. By examining these key indicators, we aim to offer valuable insights and predictions for informed decision-making.
Trend Analysis:
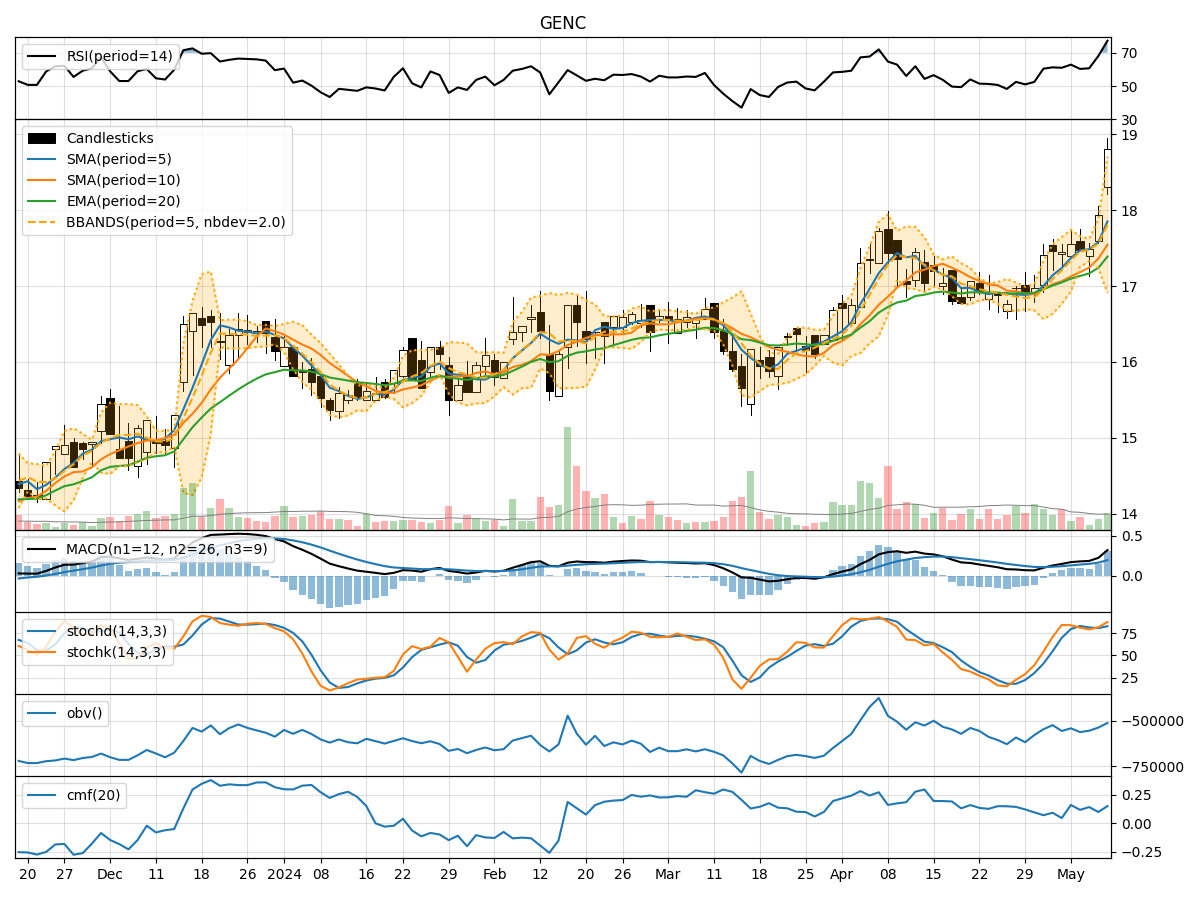
- Moving Averages (MA): The 5-day Moving Average (MA) has been consistently below the Simple Moving Average (SMA) and Exponential Moving Average (EMA), indicating a downward trend.
- MACD: The MACD line has been decreasing, with the MACD line crossing below the signal line, suggesting a bearish momentum.
- RSI: The Relative Strength Index (RSI) has been declining, indicating weakening buying pressure.
Key Observation: The trend indicators point towards a bearish outlook for GENC in the short term.
Momentum Analysis:
- Stochastic Oscillator: Both %K and %D have been decreasing, signaling a loss in momentum.
- Williams %R: The Williams %R is in oversold territory, indicating a potential reversal.
Key Observation: Momentum indicators suggest a weakening momentum for GENC.
Volatility Analysis:
- Bollinger Bands (BB): The stock price has been trading within the lower Bollinger Band, indicating lower volatility.
- Bollinger %B: The Bollinger %B is below 0.2, suggesting the stock is oversold.
Key Observation: Volatility indicators imply low volatility and a possible oversold condition for GENC.
Volume Analysis:
- On-Balance Volume (OBV): The OBV has been relatively stable, indicating a balance between buying and selling pressure.
- Chaikin Money Flow (CMF): The CMF has been decreasing, suggesting a decrease in buying pressure.
Key Observation: Volume indicators show neutral volume activity with a slight bearish bias.
Conclusion:
Based on the analysis of trend, momentum, volatility, and volume indicators, the overall outlook for GENC in the next few days is bearish. The stock is likely to experience further downward movement, supported by the weakening trend, momentum, and volume activity. Traders and investors should exercise caution and consider potential short-selling opportunities or wait for a more favorable entry point.
Key Conclusion: The next few days for GENC are likely to see downward price movement, indicating a bearish trend in the short term.