Technical Analysis of GAU 2024-05-10
Overview:
In analyzing the technical indicators for GAU over the last 5 days, we will delve into the trend, momentum, volatility, and volume indicators to provide a comprehensive outlook on the possible stock price movement. By examining these key factors, we aim to offer valuable insights and predictions for the upcoming days.
Trend Analysis:
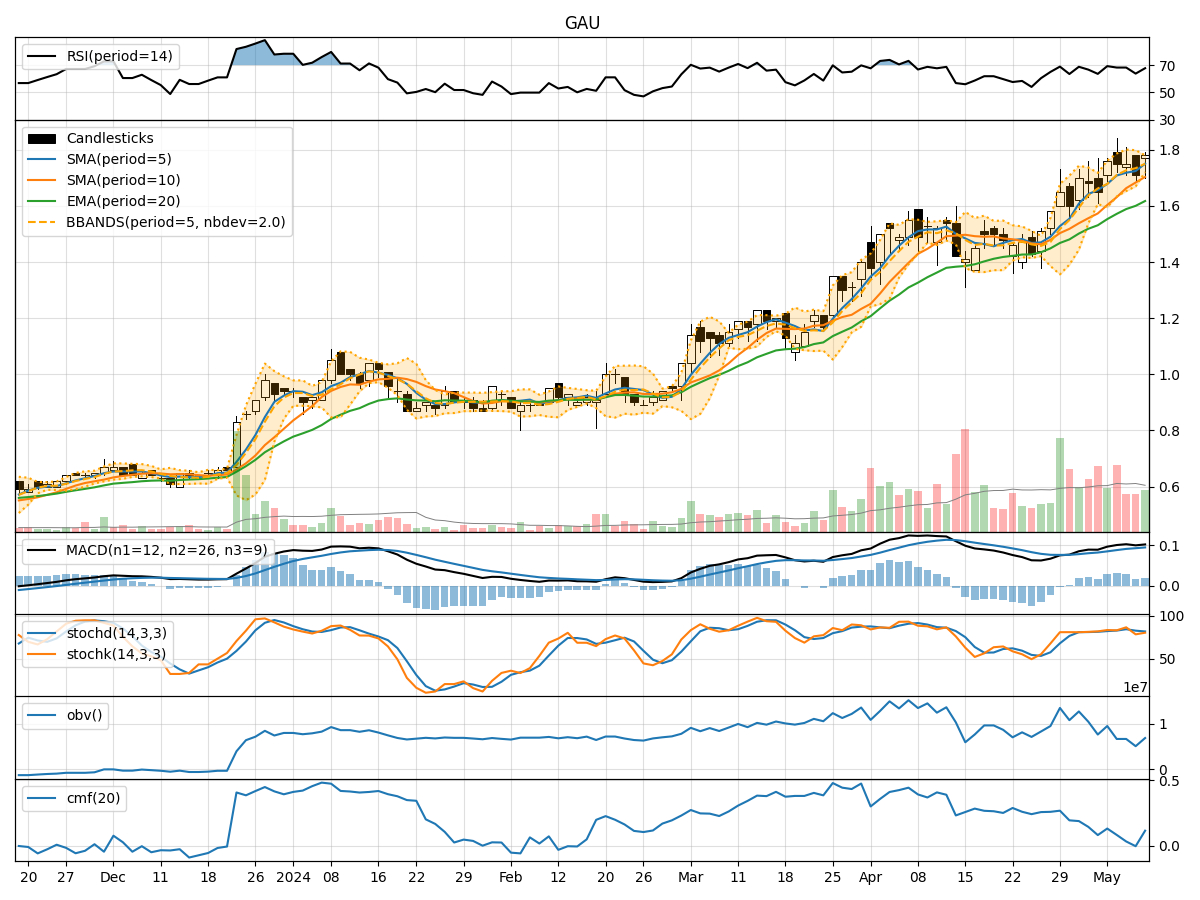
- Moving Averages (MA): The moving averages have been showing an upward trend, with the 5-day MA consistently above the 10-day SMA, indicating positive momentum.
- MACD: The MACD line has been above the signal line, suggesting a bullish trend in the stock price.
- EMA: The exponential moving average has been steadily increasing, supporting the bullish sentiment in the short to medium term.
Momentum Analysis:
- RSI: The Relative Strength Index has been fluctuating but generally staying within the neutral to overbought territory, indicating potential strength in the stock.
- Stochastic Oscillator: Both %K and %D have been in the overbought zone, suggesting a potential reversal or consolidation in the near future.
- Williams %R: The Williams %R has been oscillating, showing mixed signals for the stock's momentum.
Volatility Analysis:
- Bollinger Bands: The Bollinger Bands have been widening, indicating increased volatility in the stock price.
- Bollinger %B: The %B indicator has been fluctuating within a wide range, reflecting the heightened volatility in the stock.
Volume Analysis:
- On-Balance Volume (OBV): The OBV has shown mixed signals, with some days experiencing buying pressure and others showing selling pressure.
- Chaikin Money Flow (CMF): The CMF has been positive, indicating that money is flowing into the stock, supporting the bullish sentiment.
Key Observations:
- The trend indicators suggest a bullish outlook, supported by moving averages and MACD.
- Momentum indicators show mixed signals, with RSI indicating potential strength but stochastic oscillators hinting at a possible reversal.
- Volatility has been increasing, as seen in the widening Bollinger Bands.
- Volume indicators show a mix of buying and selling pressure, with the CMF supporting the bullish sentiment.
Conclusion:
Based on the analysis of the technical indicators, the next few days for GAU could see further upward movement in the stock price. The bullish trend indicated by moving averages and MACD, coupled with positive money flow as per CMF, suggests potential strength in the stock. However, caution is advised due to mixed signals from momentum indicators like stochastic oscillators. Overall, the outlook leans towards a bullish bias with the possibility of some consolidation or volatility in the near term.