Technical Analysis of EQX 2024-05-10
Overview:
In analyzing the technical indicators for EQX over the last 5 days, we will delve into the trend, momentum, volatility, and volume indicators to provide a comprehensive outlook on the possible stock price movement. By examining these key aspects, we aim to offer valuable insights and predictions for the upcoming days.
Trend Analysis:
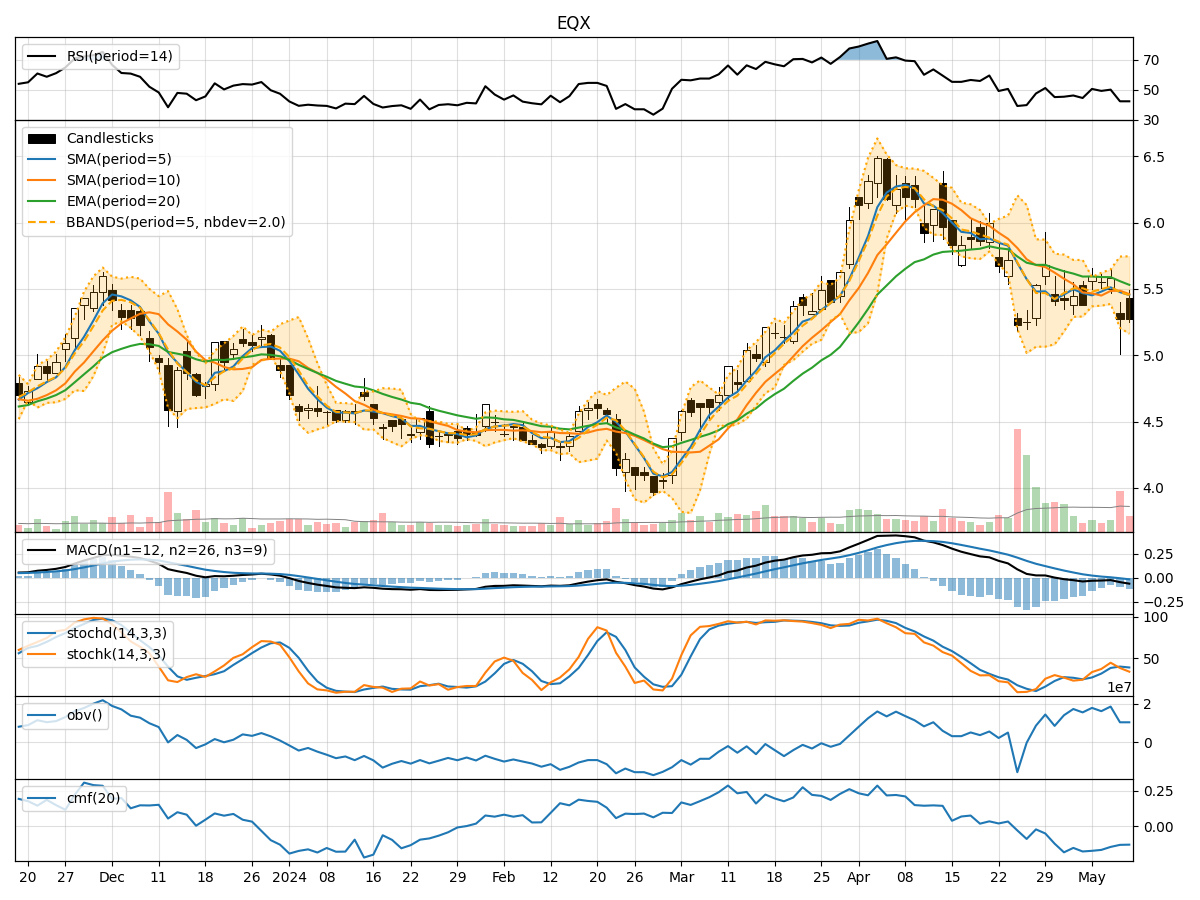
- Moving Averages (MA): The 5-day Moving Average (MA) has been fluctuating around the closing prices, indicating a lack of clear trend direction.
- MACD: The Moving Average Convergence Divergence (MACD) has been consistently negative, suggesting a bearish momentum in the short term.
- EMA: The Exponential Moving Average (EMA) has been declining, further supporting the bearish sentiment in the stock.
Momentum Analysis:
- RSI: The Relative Strength Index (RSI) has been hovering around the 40-50 range, indicating a neutral momentum with a slight bearish bias.
- Stochastic Oscillator: Both %K and %D of the Stochastic Oscillator have been in the oversold territory, signaling a potential reversal or consolidation phase.
- Williams %R: The Williams %R is in the oversold region, suggesting a possible buying opportunity in the near term.
Volatility Analysis:
- Bollinger Bands: The Bollinger Bands have been narrowing, indicating decreasing volatility and a potential period of consolidation.
- Bollinger %B: The %B indicator is below 1, suggesting that the stock price is trading below the lower Bollinger Band, which could signal an oversold condition.
Volume Analysis:
- On-Balance Volume (OBV): The OBV has been declining, indicating that selling pressure has been dominant in the recent trading sessions.
- Chaikin Money Flow (CMF): The CMF has been negative, reflecting a bearish money flow into the stock.
Conclusion:
Based on the analysis of the technical indicators, the stock of EQX is currently in a bearish phase with a lack of clear trend direction. The momentum indicators suggest a neutral to slightly bearish sentiment, while the volatility indicators point towards a potential period of consolidation. The volume indicators also support the bearish outlook, indicating selling pressure in the stock.
Forecast:
Considering the overall bearish sentiment and the lack of strong positive signals from the technical indicators, it is likely that EQX will continue to experience downward pressure in the next few days. Traders and investors should exercise caution and consider waiting for more definitive signals of a trend reversal before considering long positions.