Technical Analysis of DXF 2024-05-10
Overview:
In analyzing the technical indicators for DXF stock over the last 5 days, we will delve into the trends, momentum, volatility, and volume aspects to provide a comprehensive outlook on the possible future stock price movement. By examining key indicators such as moving averages, MACD, RSI, Bollinger Bands, and OBV, we aim to offer valuable insights and recommendations for potential price direction.
Trend Analysis:
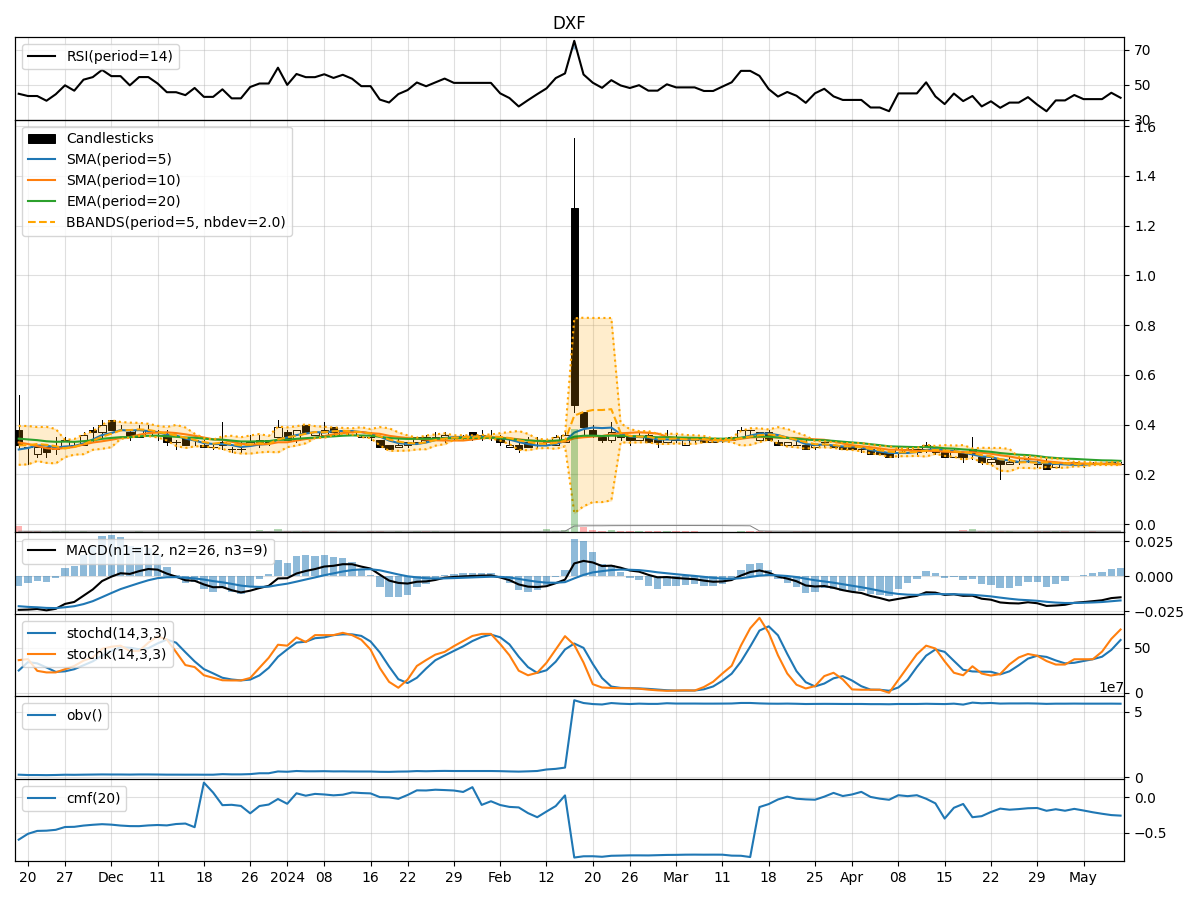
- Moving Averages (MA): The 5-day MA has been relatively stable around $0.24, indicating a neutral trend in the short term.
- MACD: The MACD line has been consistently negative, suggesting a bearish momentum in the stock price.
- EMA: The EMA(20) is gradually declining, reflecting a downward trend in the medium to long term.
Momentum Analysis:
- RSI: The RSI(14) has been hovering around 40-45, indicating a neutral to slightly bearish momentum.
- Stochastic Oscillator: The Stochastics show an upward trend, with the %K and %D lines moving towards overbought territory.
- Williams %R: The Williams %R is in oversold territory, suggesting a potential reversal in the short term.
Volatility Analysis:
- Bollinger Bands: The stock price has been trading within the Bollinger Bands, indicating a period of consolidation and low volatility.
- Bollinger %B: The %B indicator is below 0.5, signaling a potential oversold condition.
Volume Analysis:
- On-Balance Volume (OBV): The OBV has been relatively stable, indicating a balance between buying and selling pressure.
- Chaikin Money Flow (CMF): The CMF(20) is negative, suggesting a net outflow of money from the stock.
Key Observations:
- The stock is currently in a consolidation phase with low volatility and mixed momentum signals.
- The moving averages and MACD indicate a bearish bias in the medium term.
- The Stochastic Oscillator suggests a potential short-term bullish reversal.
- The OBV reflects a neutral volume trend, while the CMF indicates a slight bearish sentiment.
Conclusion:
Based on the technical analysis of DXF stock, the overall outlook leans towards a sideways movement in the near term, with a slight bearish bias in the medium to long term. Traders should exercise caution and monitor key levels such as support and resistance for potential entry or exit points. It is advisable to wait for clearer signals or confirmation from multiple indicators before making significant trading decisions.