Technical Analysis of CYBN 2024-05-10
Overview:
In analyzing the technical indicators for CYBN over the last 5 days, we will delve into the trends, momentum, volatility, and volume indicators to provide a comprehensive outlook on the possible stock price movement in the coming days. By examining these key aspects, we aim to offer valuable insights and predictions for potential investors.
Trend Analysis:
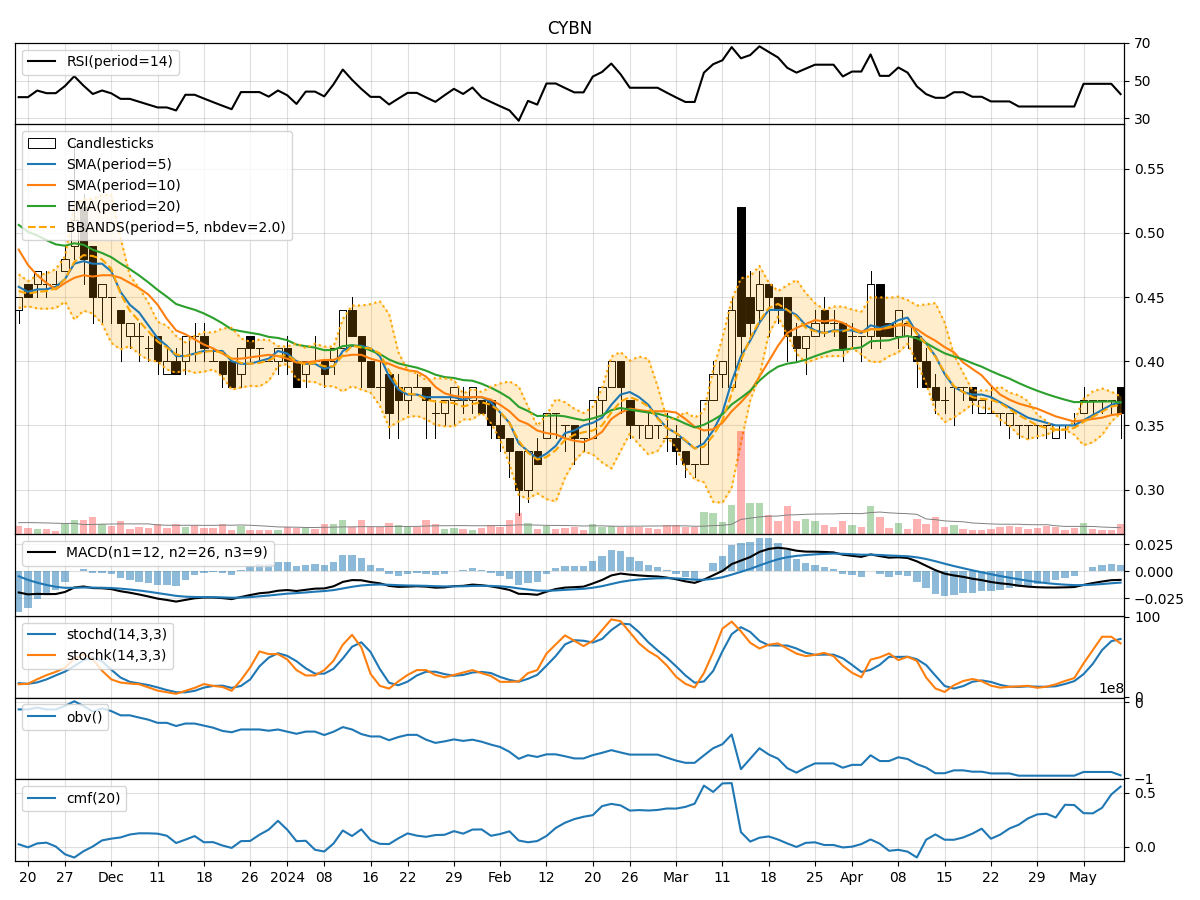
- Moving Averages (MA): The 5-day Moving Average (MA) has been gradually increasing, indicating a slight upward trend in the short term.
- MACD: The Moving Average Convergence Divergence (MACD) has been negative but showing signs of convergence towards the signal line, suggesting a potential reversal in the bearish momentum.
- EMA: The Exponential Moving Average (EMA) has been relatively stable, indicating a neutral trend in the medium term.
Momentum Analysis:
- RSI: The Relative Strength Index (RSI) has been hovering around 50, indicating a balanced momentum between buying and selling pressure.
- Stochastic Oscillator: The Stochastic Oscillator shows fluctuations but has recently crossed below the overbought threshold, signaling a potential bearish momentum.
- Williams %R: The Williams %R is in the oversold territory, suggesting a possible reversal in the short term.
Volatility Analysis:
- Bollinger Bands: The Bollinger Bands have been narrowing, indicating decreasing volatility and a potential period of consolidation.
- Bollinger %B: The %B indicator is close to 0, suggesting that the stock price is near the lower band, potentially indicating an oversold condition.
Volume Analysis:
- On-Balance Volume (OBV): The OBV has been negative, indicating a net selling pressure in the market.
- Chaikin Money Flow (CMF): The CMF has been increasing, suggesting a potential inflow of money into the stock.
Key Observations and Opinions:
- Trend: The trend indicators show a mixed picture, with a slight upward bias in the short term but a neutral stance in the medium term.
- Momentum: Momentum indicators suggest a potential shift towards bearish sentiment in the short term.
- Volatility: Volatility is decreasing, indicating a period of consolidation and potential price stabilization.
- Volume: The volume indicators reflect selling pressure but with a recent uptick in the CMF, signaling a possible reversal.
Conclusion:
Based on the analysis of the technical indicators, the next few days for CYBN could see sideways movement with a slight bearish bias. Investors should exercise caution and closely monitor key support and resistance levels. It is advisable to wait for further confirmation of a trend reversal before considering any significant buying positions.