Technical Analysis of COE 2024-05-10
Overview:
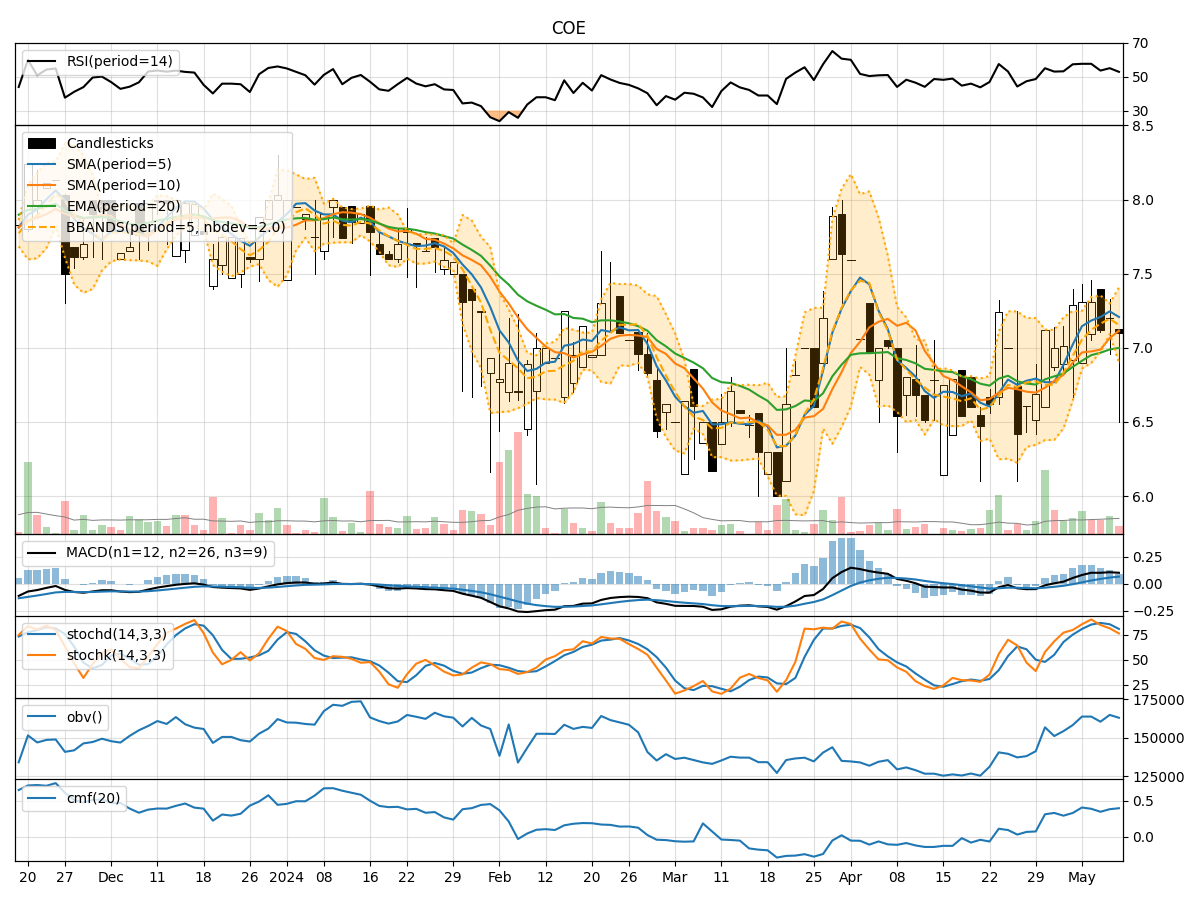
In analyzing the technical indicators for COE stock over the last 5 days, we will delve into the trend, momentum, volatility, and volume indicators to provide a comprehensive outlook on the possible stock price movement in the coming days.
Trend Analysis:
- Moving Averages (MA): The 5-day Moving Average (MA) has been fluctuating around the current price, indicating a lack of clear trend direction.
- MACD: The MACD line has been positive, suggesting a bullish momentum in the short term.
- RSI: The Relative Strength Index (RSI) has been hovering around the neutral zone, indicating a balanced buying and selling pressure.
Momentum Analysis:
- Stochastic Oscillator: The Stochastic Oscillator has been fluctuating but generally in the overbought territory, signaling a potential reversal or consolidation.
- Williams %R: The Williams %R indicator has been in the oversold region, indicating a possible buying opportunity.
Volatility Analysis:
- Bollinger Bands (BB): The Bollinger Bands have been narrowing, suggesting decreasing volatility and a potential breakout or significant price movement ahead.
Volume Analysis:
- On-Balance Volume (OBV): The OBV has shown mixed signals, reflecting indecision among market participants.
- Chaikin Money Flow (CMF): The CMF has been positive, indicating buying pressure in the market.
Key Observations:
- The trend indicators show a lack of clear direction, with mixed signals from moving averages and oscillators.
- Momentum indicators suggest a potential reversal or consolidation phase.
- Volatility indicators point towards a potential breakout or significant price movement.
- Volume indicators reflect indecision among traders, with a slight bias towards buying pressure.
Conclusion:
Based on the analysis of the technical indicators, the stock price of COE is likely to experience sideways movement in the coming days, with a potential for increased volatility and a possible breakout. Traders should closely monitor key support and resistance levels for potential entry or exit points. It is advisable to wait for more confirmation from the indicators before taking significant trading positions.