Technical Analysis of CHAA 2024-05-10
Overview:
In analyzing the technical indicators for CHAA over the last 5 days, we will delve into the trend, momentum, volatility, and volume indicators to provide a comprehensive outlook on the possible stock price movement. By examining these key aspects, we aim to offer valuable insights and predictions for the upcoming days.
Trend Analysis:
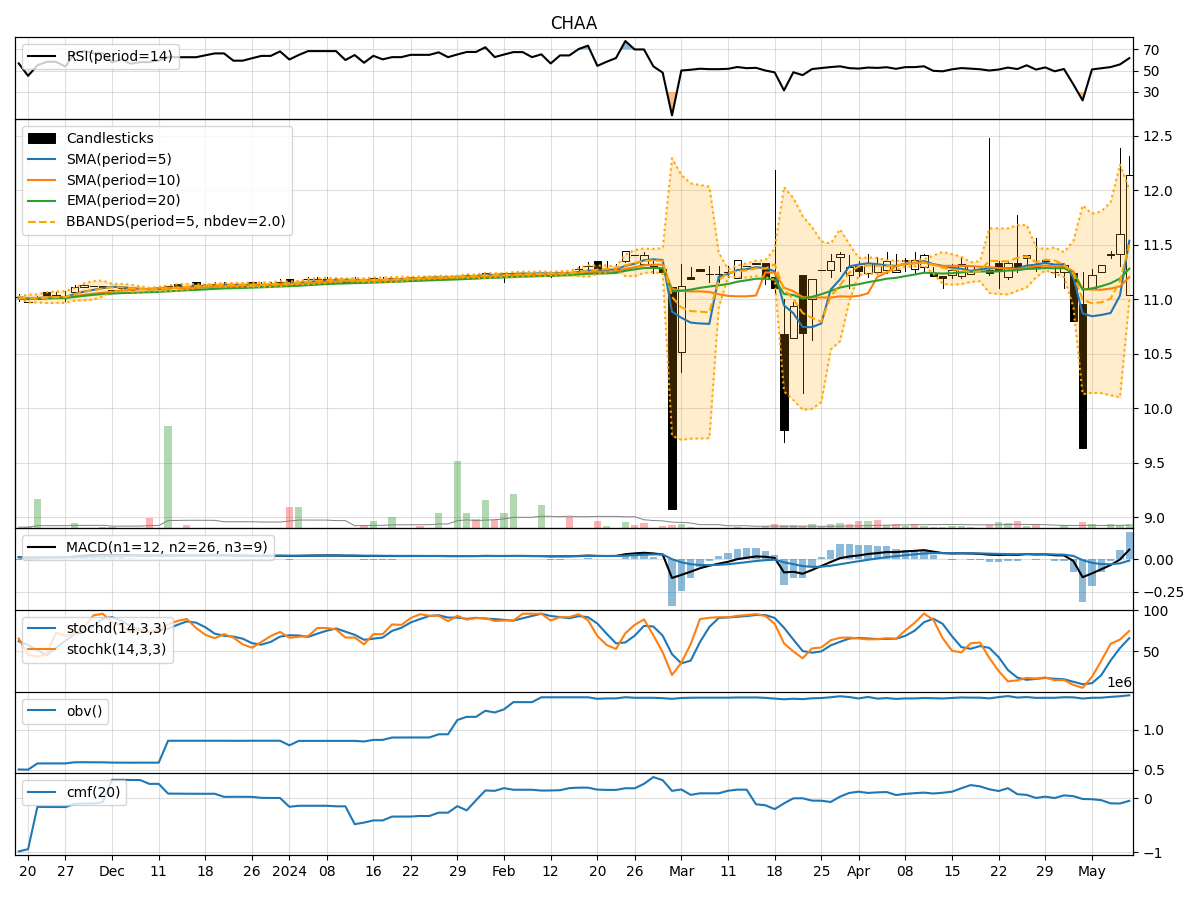
- Moving Averages (MA): The 5-day Moving Average (MA) has been consistently rising, indicating an upward trend in the stock price.
- MACD: The MACD line has been positive, with the MACD Histogram also showing an increasing trend, suggesting bullish momentum.
Momentum Analysis:
- RSI: The Relative Strength Index (RSI) has been increasing, reaching a level of 61.76 on the last trading day, indicating strengthening momentum.
- Stochastic Oscillator: Both %K and %D values of the Stochastic Oscillator are in the overbought zone, signaling a potential reversal or consolidation.
Volatility Analysis:
- Bollinger Bands (BB): The Bollinger Bands have widened, indicating increased volatility in the stock price.
Volume Analysis:
- On-Balance Volume (OBV): The OBV has been steadily increasing, suggesting accumulation by investors.
- Chaikin Money Flow (CMF): The CMF has been negative, indicating selling pressure in the stock.
Key Observations:
- The stock has shown a strong upward trend based on moving averages and MACD.
- Momentum indicators like RSI suggest bullish momentum, but the Stochastic Oscillator signals potential overbought conditions.
- Volatility has increased, as seen in the widening Bollinger Bands.
- Volume indicators show accumulation based on OBV but selling pressure according to CMF.
Conclusion:
Based on the analysis of technical indicators, the stock is likely to experience a short-term consolidation or pullback due to the overbought conditions indicated by the Stochastic Oscillator and the negative CMF. However, the overall trend remains bullish, supported by the positive MACD and increasing RSI. Traders may consider taking profits or waiting for a better entry point during the consolidation phase. Long-term investors can hold their positions, considering the overall positive trend in the stock price.
Recommendation:
- Short-term Traders: Consider booking profits or waiting for a pullback to enter at a more favorable price.
- Long-term Investors: Hold positions, considering the overall bullish trend and positive momentum indicators.
By carefully monitoring the indicators and market dynamics, investors can make informed decisions aligned with their risk tolerance and investment goals.