Technical Analysis of BQ 2024-05-10
Overview:
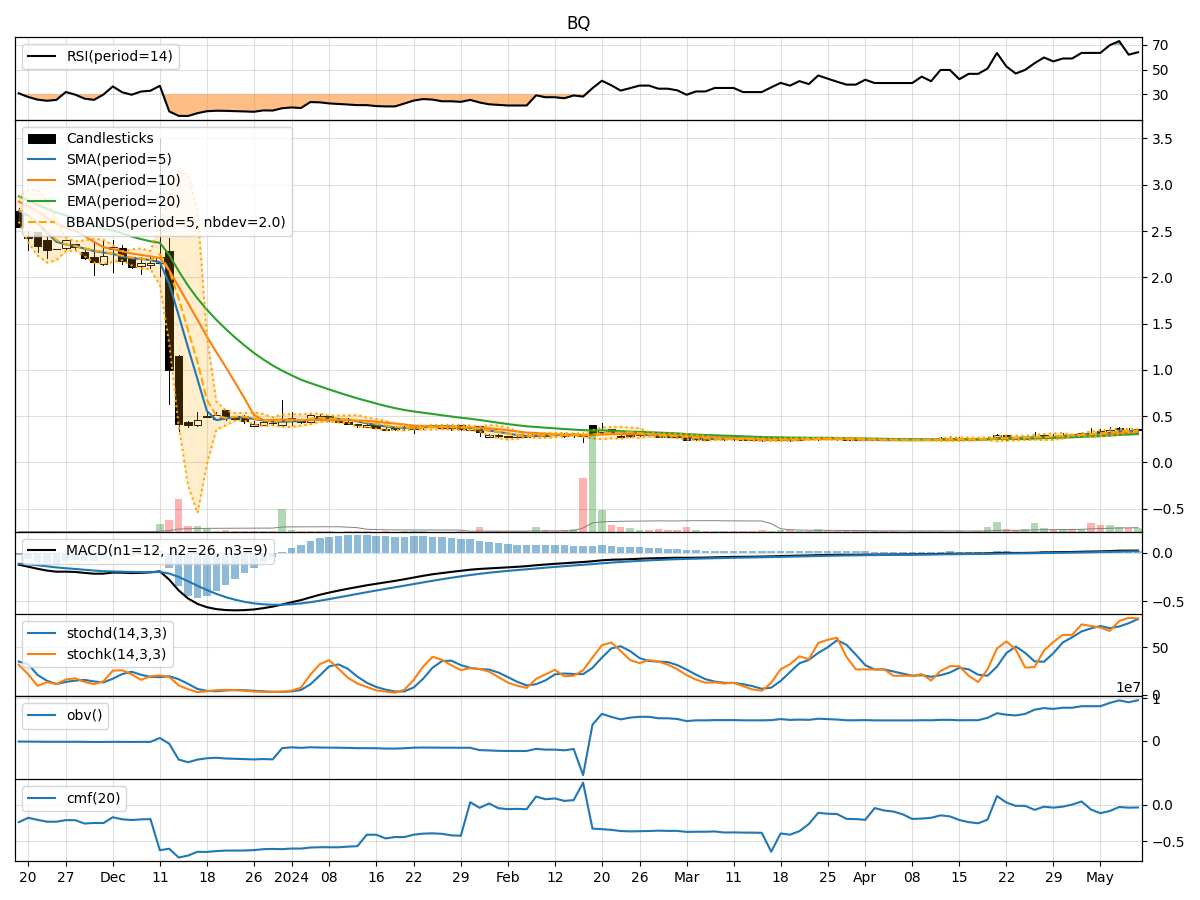
In analyzing the technical indicators for BQ stock over the last 5 days, we will delve into the trends, momentum, volatility, and volume aspects to provide a comprehensive outlook on the possible future stock price movement. By examining key indicators such as moving averages, MACD, RSI, Bollinger Bands, and OBV, we aim to offer valuable insights and predictions for the upcoming trading days.
Trend Analysis:
- Moving Averages (MA): The 5-day moving average has been consistently trending upwards, indicating a bullish momentum in the short term.
- MACD: The MACD line has been above the signal line, suggesting a positive trend in momentum.
- EMA: The exponential moving average has also been on an upward trajectory, supporting the bullish sentiment.
Momentum Analysis:
- RSI: The Relative Strength Index has shown fluctuations but generally remains in the neutral zone, indicating a balanced momentum.
- Stochastic Oscillator: Both %K and %D have been in the overbought territory, signaling a potential reversal or consolidation.
- Williams %R: The Williams %R has been fluctuating but is currently in the oversold region, hinting at a possible buying opportunity.
Volatility Analysis:
- Bollinger Bands: The bands have been widening, suggesting increased volatility in the stock price.
- Bollinger %B: The %B indicator has been fluctuating within the bands, indicating potential price reversals or breakouts.
Volume Analysis:
- On-Balance Volume (OBV): The OBV has shown mixed signals, with slight increases and decreases in volume accumulation.
- Chaikin Money Flow (CMF): The CMF remains negative, indicating selling pressure in the market.
Key Observations:
- The stock is currently in an upward trend based on moving averages and MACD.
- Momentum indicators suggest a mixed sentiment with potential for a reversal.
- Volatility is increasing, indicating potential price swings.
- Volume indicators show neutral to bearish signals with selling pressure.
Conclusion:
Based on the analysis of technical indicators, the next few days for BQ stock could see further upward movement in price, supported by the positive trend in moving averages and MACD. However, caution is advised as momentum indicators show signs of potential reversal, and increased volatility could lead to price fluctuations. Traders should closely monitor key levels and wait for confirmation of sustained bullish momentum before making significant trading decisions.