Technical Analysis of BLUA 2024-05-31
Overview:
In analyzing the technical indicators for BLUA stock over the last 5 days, we will delve into the trends, momentum, volatility, and volume indicators to provide a comprehensive outlook on the possible stock price movement in the coming days. By examining these key indicators, we aim to offer valuable insights and recommendations for potential investors.
Trend Indicators:
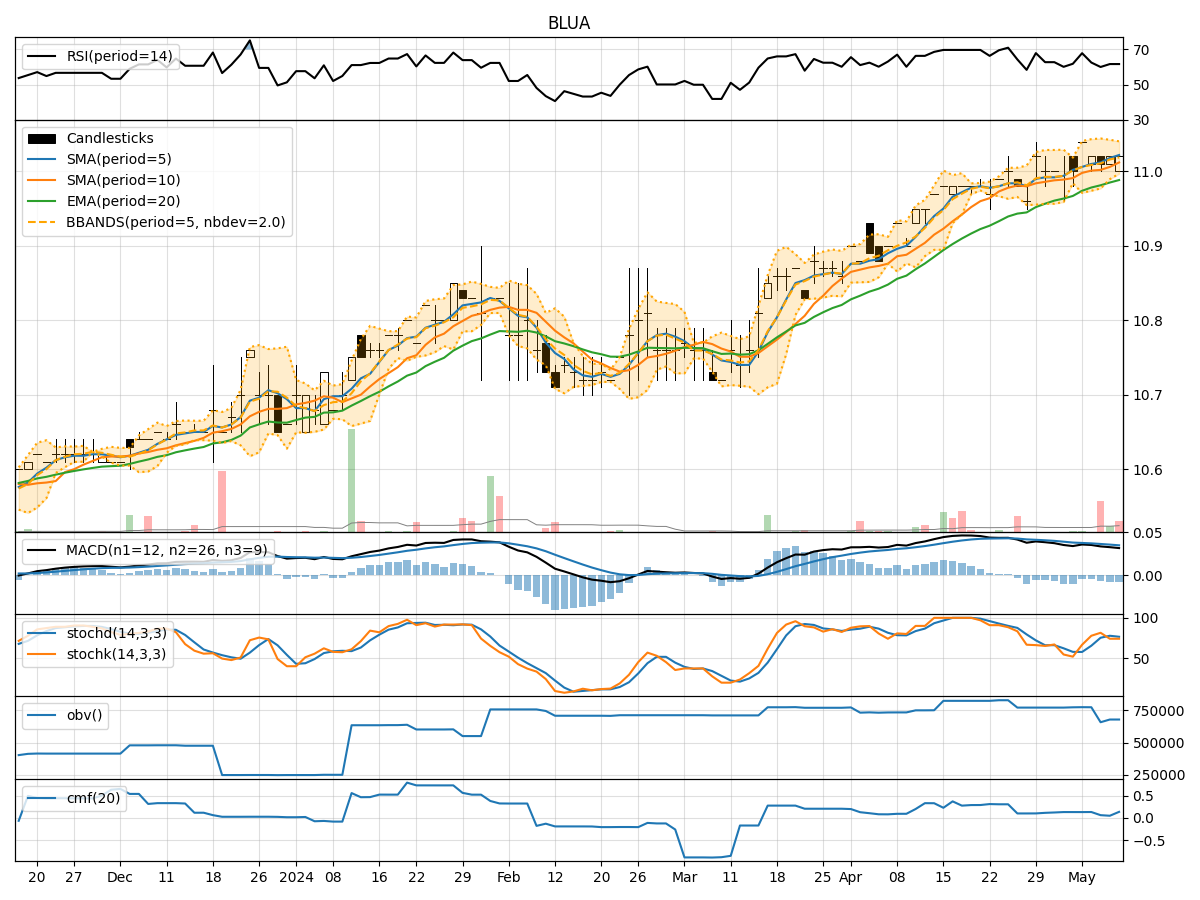
- Moving Averages (MA): The 5-day MA has been fluctuating around the closing prices, indicating a relatively stable trend.
- MACD: The MACD line has been positive, suggesting a bullish momentum in the short term.
- MACD Histogram: The MACD histogram has shown slight fluctuations but remains above the zero line, indicating positive momentum.
Momentum Indicators:
- RSI: The RSI has been oscillating around the 50 level, indicating a neutral momentum.
- Stochastic Oscillator: The stochastic indicators have shown mixed signals, with no clear trend direction.
- Williams %R: The Williams %R has been fluctuating in the oversold and neutral zones, suggesting indecision in the market.
Volatility Indicators:
- Bollinger Bands: The Bollinger Bands have been narrowing, indicating decreasing volatility.
- Bollinger %B: The %B indicator has been hovering around the midline, reflecting a lack of strong trend direction.
Volume Indicators:
- On-Balance Volume (OBV): The OBV has shown a slight decrease, indicating some selling pressure.
- Chaikin Money Flow (CMF): The CMF has been relatively stable around the zero line, suggesting a balance between buying and selling pressure.
Key Observations and Opinions:
- Trend: The trend indicators suggest a neutral to slightly bullish sentiment in the short term.
- Momentum: The momentum indicators show mixed signals, with no clear direction in the market.
- Volatility: Volatility has been decreasing, indicating a potential period of consolidation.
- Volume: The volume indicators reflect a balanced market sentiment with a slight inclination towards selling pressure.
Conclusion:
Based on the analysis of the technical indicators, the next few days for BLUA stock are likely to see sideways movement with a neutral bias. Investors should exercise caution and closely monitor the trend and momentum indicators for any potential shifts in market sentiment. It is advisable to wait for clearer signals before making significant trading decisions.