Technical Analysis of BGI 2024-05-10
Overview:
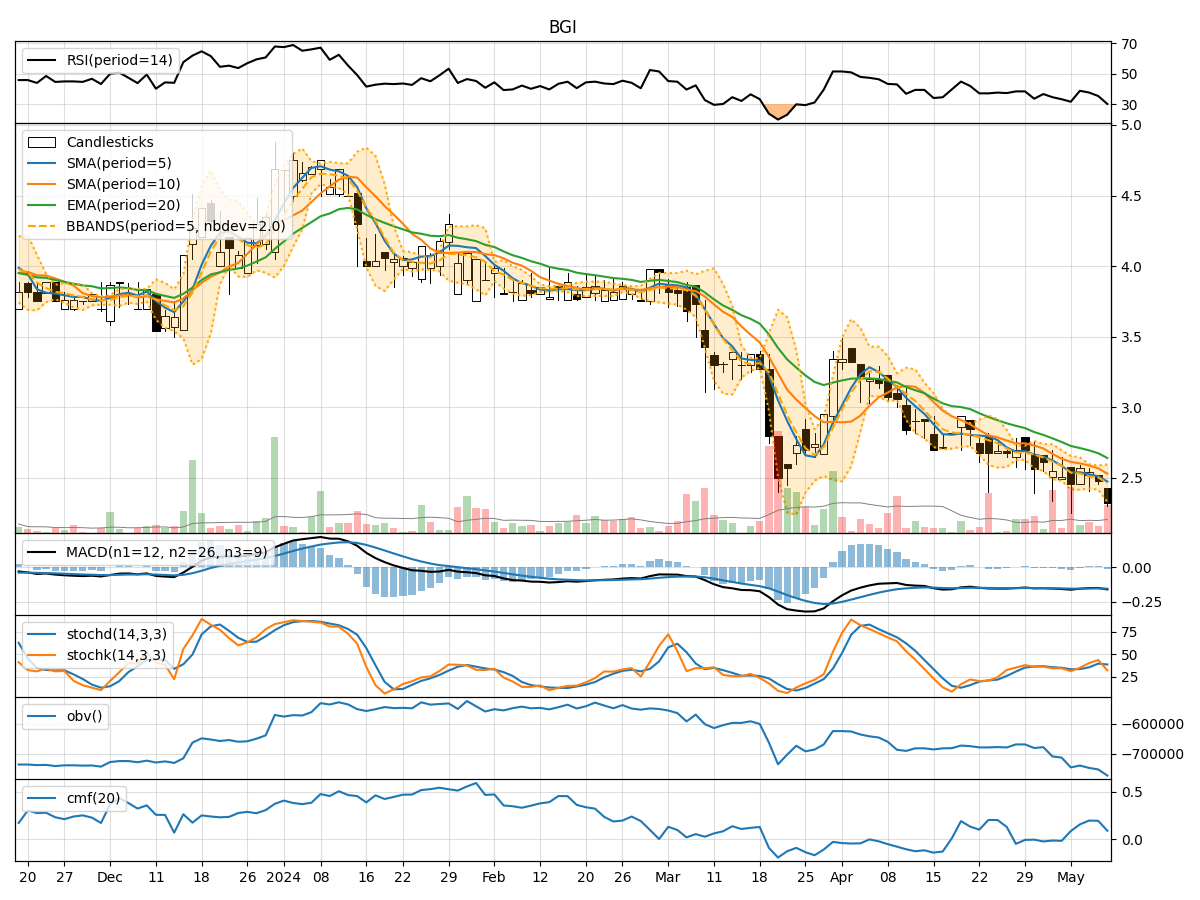
In analyzing the technical indicators for BGI over the last 5 days, we will delve into the trend, momentum, volatility, and volume indicators to provide a comprehensive outlook on the possible stock price movement in the coming days.
Trend Analysis:
- Moving Averages (MA): The 5-day MA has been declining, indicating a short-term bearish trend.
- MACD: The MACD line has been consistently below the signal line, suggesting a bearish momentum.
- EMA: The EMA has been trending downwards, reflecting a bearish sentiment in the stock.
Momentum Analysis:
- RSI: The RSI has been below 50, indicating a bearish momentum in the stock.
- Stochastic Oscillator: Both %K and %D have been trending downwards, signaling a bearish sentiment.
- Williams %R: The indicator has been in oversold territory, suggesting a potential reversal or continuation of the downtrend.
Volatility Analysis:
- Bollinger Bands: The stock price has been trading below the lower Bollinger Band, indicating oversold conditions.
- Bollinger %B: The %B indicator is near 0, suggesting a potential bounce back in the stock price.
Volume Analysis:
- On-Balance Volume (OBV): The OBV has been declining, indicating selling pressure in the stock.
- Chaikin Money Flow (CMF): The CMF has been positive but decreasing, signaling a potential outflow of money from the stock.
Key Observations:
- The stock is currently in a bearish trend based on moving averages and MACD.
- Momentum indicators like RSI and Stochastic Oscillator support the bearish sentiment.
- Volatility indicators suggest oversold conditions, potentially hinting at a reversal.
- Volume indicators show selling pressure with a slight outflow of money from the stock.
Conclusion:
Based on the analysis of the technical indicators, the stock is likely to experience further downward movement in the coming days. The bearish trend, supported by momentum indicators and volume analysis, indicates a potential continuation of the current downtrend. Traders and investors should exercise caution and consider shorting or staying away from long positions until a clear reversal pattern emerges.