Technical Analysis of YINN 2024-05-10
Overview:
In analyzing the technical indicators for YINN over the last 5 days, we will delve into the trend, momentum, volatility, and volume indicators to provide a comprehensive outlook on the possible stock price movement in the coming days. By examining these key aspects, we aim to offer valuable insights and recommendations for potential investors.
Trend Analysis:
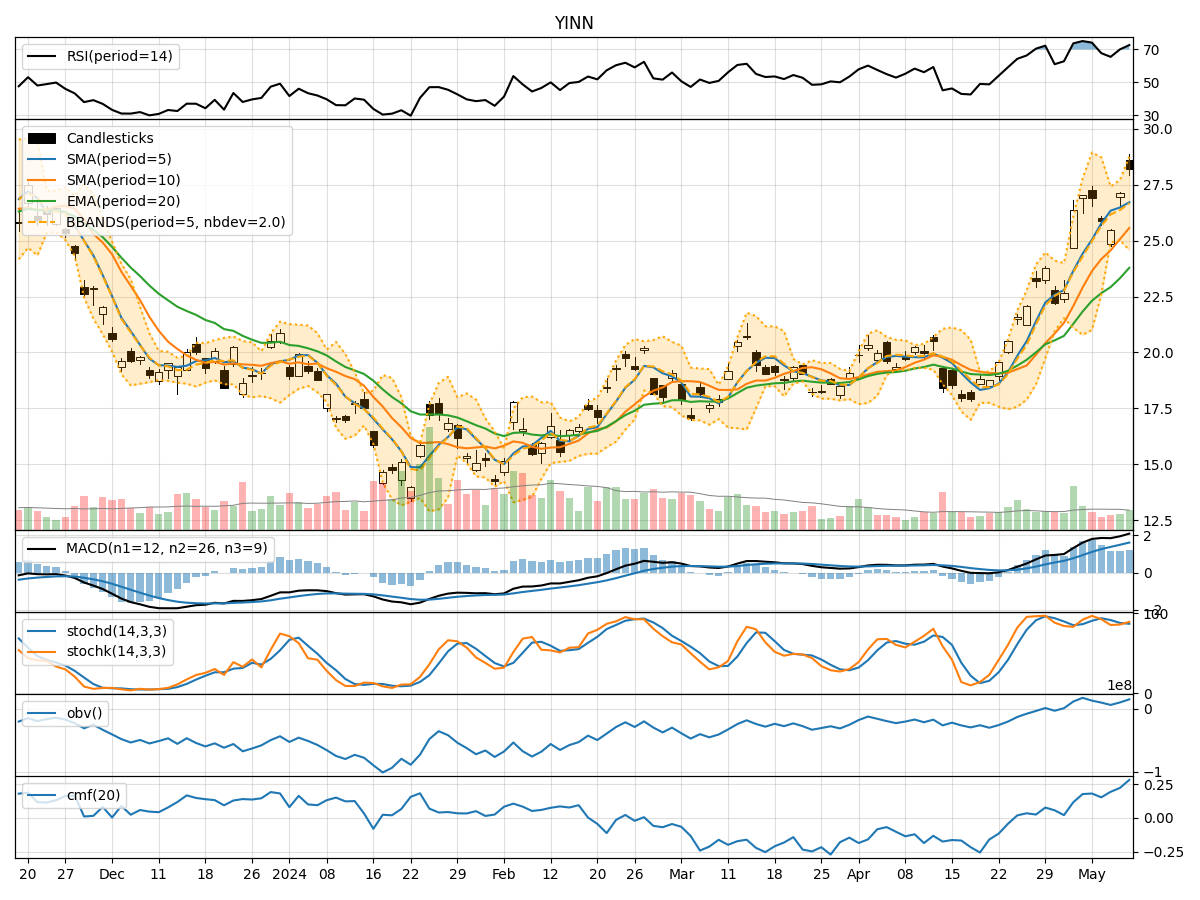
- Moving Averages (MA): The 5-day Moving Average (MA) has been consistently above the Simple Moving Average (SMA) and Exponential Moving Average (EMA), indicating a bullish trend.
- MACD: The MACD line has been above the signal line, with both lines showing an upward trend, suggesting bullish momentum.
Momentum Analysis:
- RSI: The Relative Strength Index (RSI) has been fluctuating in the overbought territory, indicating strong buying pressure.
- Stochastic Oscillator: Both %K and %D have been relatively high, suggesting bullish momentum.
Volatility Analysis:
- Bollinger Bands (BB): The stock price has been trading within the upper Bollinger Band (BBU), indicating high volatility.
Volume Analysis:
- On-Balance Volume (OBV): The OBV has been increasing, reflecting higher buying volume.
- Chaikin Money Flow (CMF): The CMF has been positive, indicating money flow into the stock.
Key Observations:
- The trend indicators suggest a strong bullish sentiment, supported by the moving averages and MACD.
- Momentum indicators show overbought conditions but still reflect bullish momentum.
- Volatility remains high, as indicated by the Bollinger Bands, potentially leading to significant price swings.
- Increasing OBV and positive CMF signal strong buying interest in the stock.
Conclusion:
Based on the analysis of the technical indicators, the stock price of YINN is likely to continue its upward trajectory in the coming days. The bullish trend, supported by strong momentum and buying volume, indicates a favorable outlook for potential price appreciation. However, investors should remain cautious of the high volatility levels, which could lead to sharp price fluctuations. Overall, the technical analysis suggests a bullish view for YINN in the near term.