Technical Analysis of XTOC 2024-05-10
Overview:
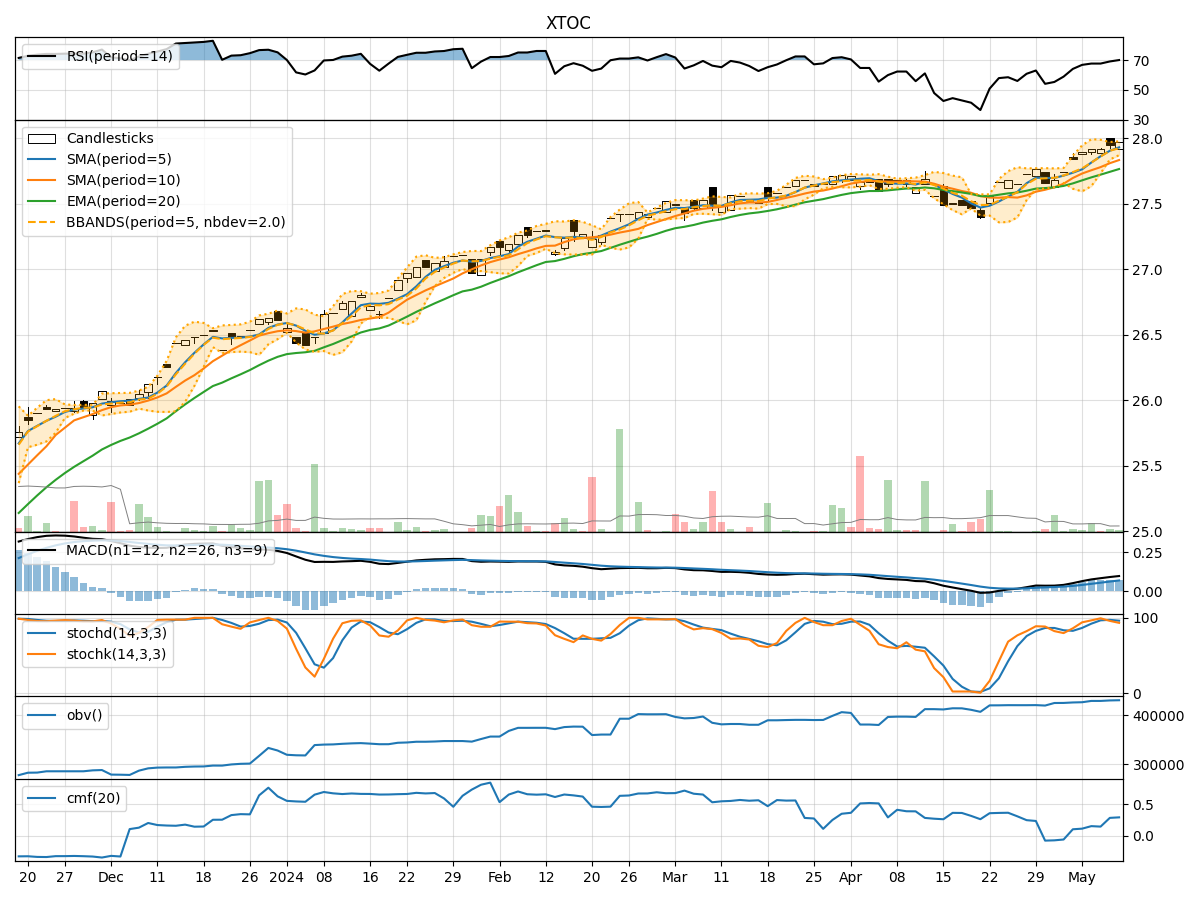
In the last 5 trading days, XTOC stock has shown a consistent uptrend in its price, supported by increasing volumes. The moving averages have been trending upwards, indicating a positive momentum. The MACD and RSI are also showing bullish signals. However, the stock is currently trading near its upper Bollinger Band, suggesting a potential overbought condition. Let's delve deeper into each category of technical indicators to provide a comprehensive analysis and make a prediction for the next few days.
Trend Indicators:
- Moving Averages (MA): The 5-day MA has been consistently above both the 10-day SMA and 20-day EMA, indicating a strong uptrend.
- MACD: The MACD line has been above the signal line for the past 5 days, showing bullish momentum.
- MACD Histogram: The MACD histogram has been increasing, indicating strengthening bullish momentum.
Key Observation: The trend indicators suggest a strong bullish trend in XTOC stock.
Momentum Indicators:
- RSI: The RSI has been consistently above 50 and is trending upwards, indicating increasing buying pressure.
- Stochastic Oscillator: Both %K and %D lines of the Stochastic Oscillator are in the overbought zone, suggesting a potential reversal.
Key Observation: Momentum indicators support the bullish trend but also hint at a possible short-term correction due to overbought conditions.
Volatility Indicators:
- Bollinger Bands: The stock price is currently near the upper Bollinger Band, indicating a potential overbought condition.
- Bollinger %B: The %B is above 0.8, suggesting the stock is trading at the upper end of its recent price range.
Key Observation: Volatility indicators signal a potential overbought scenario, which could lead to a short-term pullback or consolidation.
Volume Indicators:
- On-Balance Volume (OBV): The OBV has been steadily increasing, indicating strong buying interest in the stock.
- Chaikin Money Flow (CMF): The CMF is positive and has been trending upwards, reflecting buying pressure.
Key Observation: Volume indicators confirm the bullish trend with increasing buying volumes.
Conclusion:
Based on the analysis of technical indicators, XTOC stock is currently in a strong bullish trend supported by positive momentum and increasing volumes. However, the stock is trading near overbought levels, as indicated by the upper Bollinger Band and Stochastic Oscillator. Therefore, in the next few days, we may see a short-term correction or consolidation before the uptrend resumes.
Recommendation: Consider taking profits if you are a short-term trader, while long-term investors can hold their positions with a trailing stop loss to capture potential gains and manage risk effectively.