Technical Analysis of XTEN 2024-05-10
Overview:
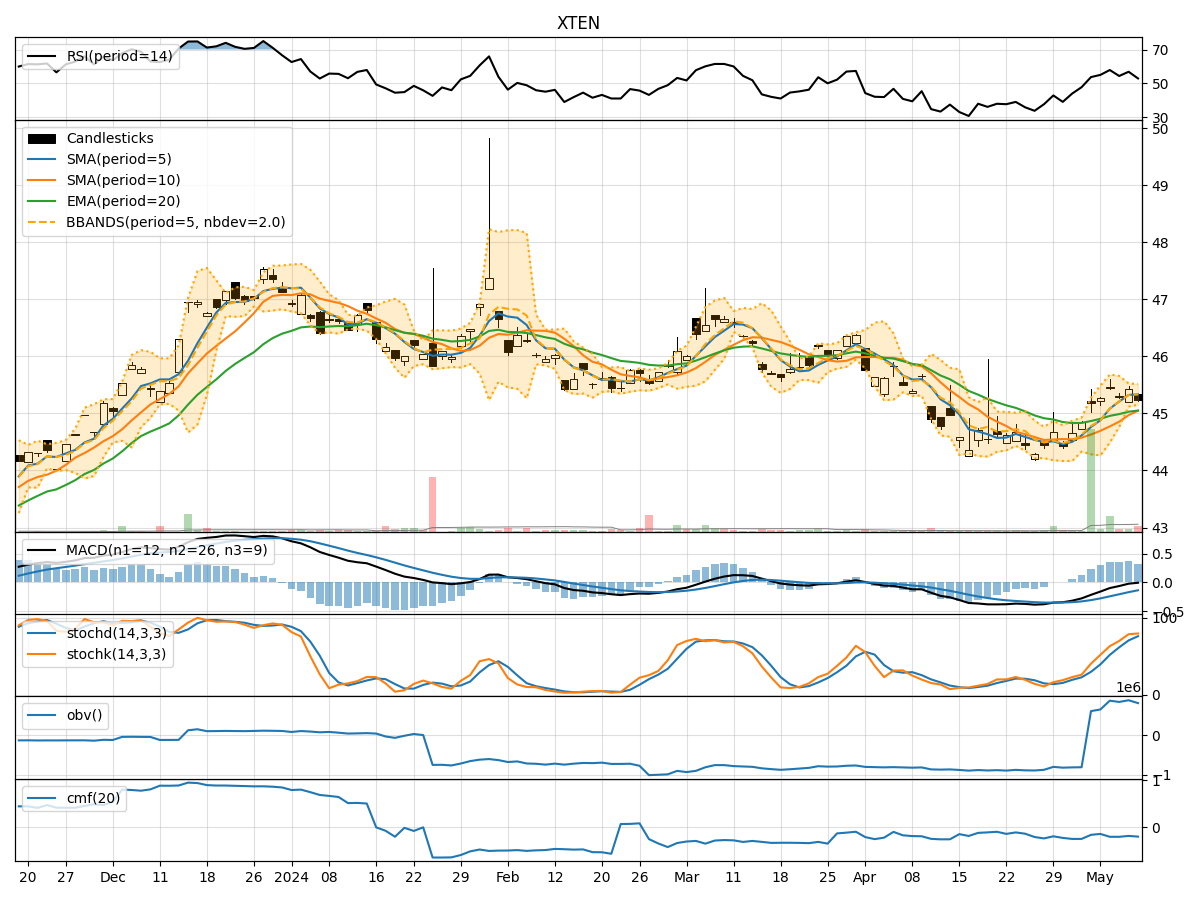
In analyzing the technical indicators for XTEN over the last 5 days, we will delve into the trend, momentum, volatility, and volume indicators to provide a comprehensive outlook on the possible stock price movement in the coming days. By examining these key indicators, we aim to offer valuable insights and recommendations for potential investors.
Trend Indicators:
- Moving Averages (MA): The 5-day moving average has been relatively stable around the current stock price, indicating a neutral trend.
- MACD: The MACD line has been hovering around the signal line, suggesting a lack of strong momentum in either direction.
- EMA: The exponential moving average has shown a slight upward trend, albeit with minimal momentum.
Key Observation: The trend indicators suggest a neutral to slightly bullish sentiment in the short term.
Momentum Indicators:
- RSI: The Relative Strength Index has been fluctuating around the 50 level, indicating a balanced momentum between buying and selling pressure.
- Stochastic Oscillator: Both %K and %D have been in the overbought territory, signaling a potential reversal or consolidation.
- Williams %R: The Williams %R is in the oversold region, suggesting a possible buying opportunity.
Key Observation: Momentum indicators point towards a potential consolidation or reversal in the near future.
Volatility Indicators:
- Bollinger Bands: The bands have been narrowing, indicating decreasing volatility and a potential breakout in the stock price.
- Bollinger %B: The %B indicator is approaching the lower band, suggesting a possible oversold condition.
Key Observation: Volatility indicators hint at a potential price breakout or reversal.
Volume Indicators:
- On-Balance Volume (OBV): The OBV has been relatively flat, indicating a balance between buying and selling pressure.
- Chaikin Money Flow (CMF): The CMF has been negative, suggesting a net outflow of money from the stock.
Key Observation: Volume indicators reflect a lack of significant buying interest in the stock.
Conclusion:
Based on the analysis of the technical indicators, the next few days' possible stock price movement for XTEN could be sideways with a slight bullish bias. The trend indicators show a neutral to slightly bullish sentiment, while momentum indicators suggest a potential consolidation or reversal. Volatility indicators hint at a possible breakout, and volume indicators indicate a lack of significant buying interest.
Overall, the stock is likely to trade within a narrow range with a potential for a slight upside movement. Investors should closely monitor key support and resistance levels for potential trading opportunities.