Technical Analysis of XPP 2024-05-10
Overview:
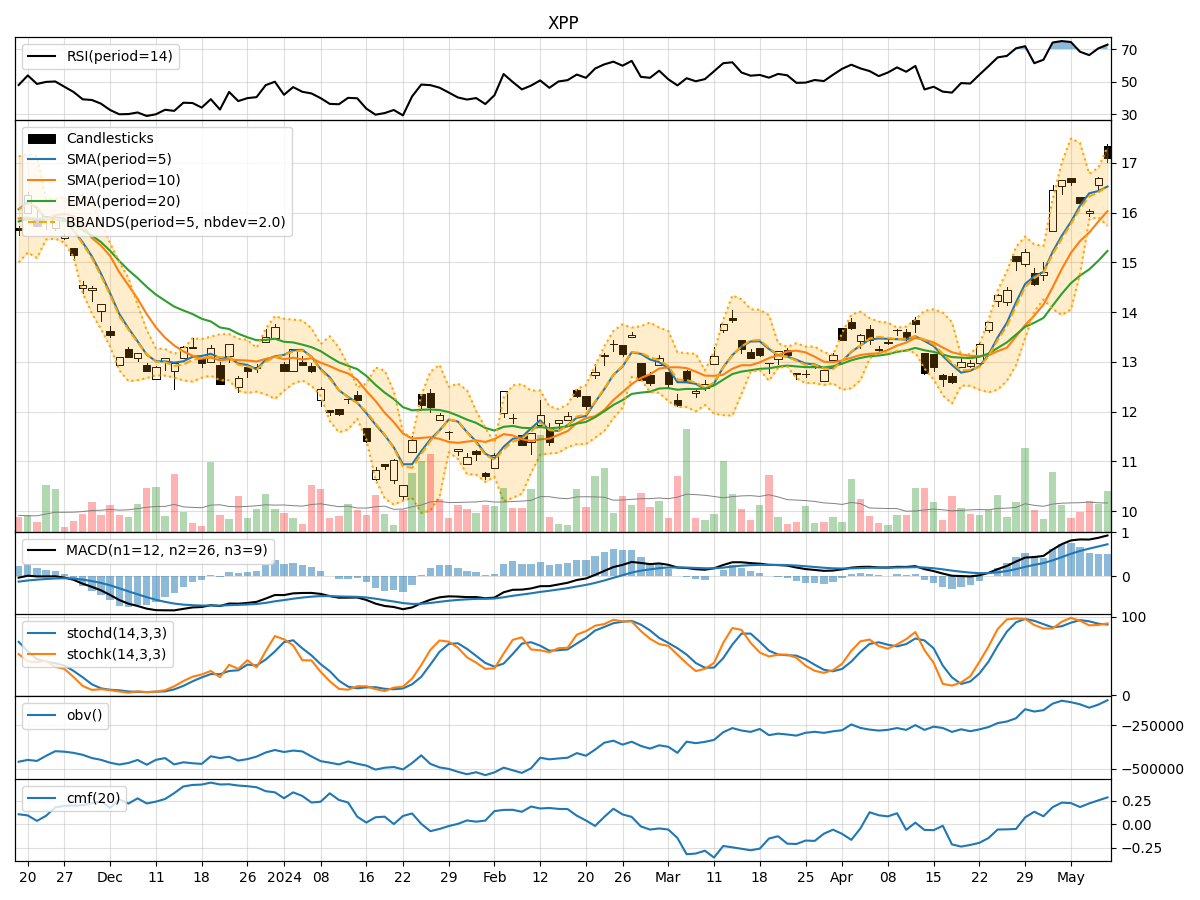
In the last 5 trading days, XPP stock has shown a mixed performance with fluctuations in price and volume. The trend indicators suggest a gradual increase in the moving averages and MACD values. Momentum indicators like RSI and Stochastic oscillators indicate a slightly overbought condition. Volatility indicators show fluctuating Bollinger Bands, while volume indicators display a positive trend in On-Balance Volume (OBV) and Chaikin Money Flow (CMF).
Trend Indicators Analysis:
- Moving averages (MA) have been steadily increasing, indicating a bullish trend.
- MACD values have been positive and rising, suggesting increasing bullish momentum.
- Overall, the trend indicators point towards an upward trend in the stock price.
Momentum Indicators Analysis:
- RSI values have been relatively high, indicating a potential overbought condition.
- Stochastic oscillators show values near or above 80, suggesting an overbought market.
- Williams %R (WillR) is also indicating an oversold condition.
- The momentum indicators collectively suggest a potential for a short-term correction or consolidation in the stock price.
Volatility Indicators Analysis:
- Bollinger Bands have shown fluctuations, indicating varying levels of volatility.
- The Bollinger Band %B (bbp) has also fluctuated, suggesting changing volatility levels.
- The volatility indicators imply a mixed sentiment with no clear trend in volatility.
Volume Indicators Analysis:
- On-Balance Volume (OBV) has shown a positive trend, indicating accumulation by investors.
- Chaikin Money Flow (CMF) has been positive, suggesting buying pressure.
- The volume indicators signal a bullish sentiment in terms of volume flow.
Conclusion:
Based on the analysis of the technical indicators, the stock price of XPP is likely to experience a short-term correction or consolidation due to the overbought conditions indicated by momentum indicators like RSI and Stochastic oscillators. However, the overall trend remains bullish, supported by the positive trend in moving averages and MACD values. The volume indicators also suggest continued buying pressure. Therefore, while a short-term correction may be expected, the overall outlook for XPP stock is bullish in the near future.
Recommendation:
- Traders may consider taking profits or reducing positions in the short term due to the overbought conditions indicated by momentum indicators.
- Long-term investors can hold their positions as the overall trend remains bullish, supported by positive volume indicators.
- Monitoring the price action closely for signs of a potential reversal or continuation of the bullish trend is advisable.
Disclaimer:
This analysis is based solely on technical indicators and historical data, and actual market movements may vary. It is essential to consider other fundamental factors and risk management strategies before making any investment decisions.