Technical Analysis of XLG 2024-05-10
Overview:
In analyzing the technical indicators for XLG over the last 5 days, we will delve into the trend, momentum, volatility, and volume indicators to provide a comprehensive outlook on the possible stock price movement. By examining these key aspects, we aim to offer valuable insights and predictions for the upcoming days.
Trend Analysis:
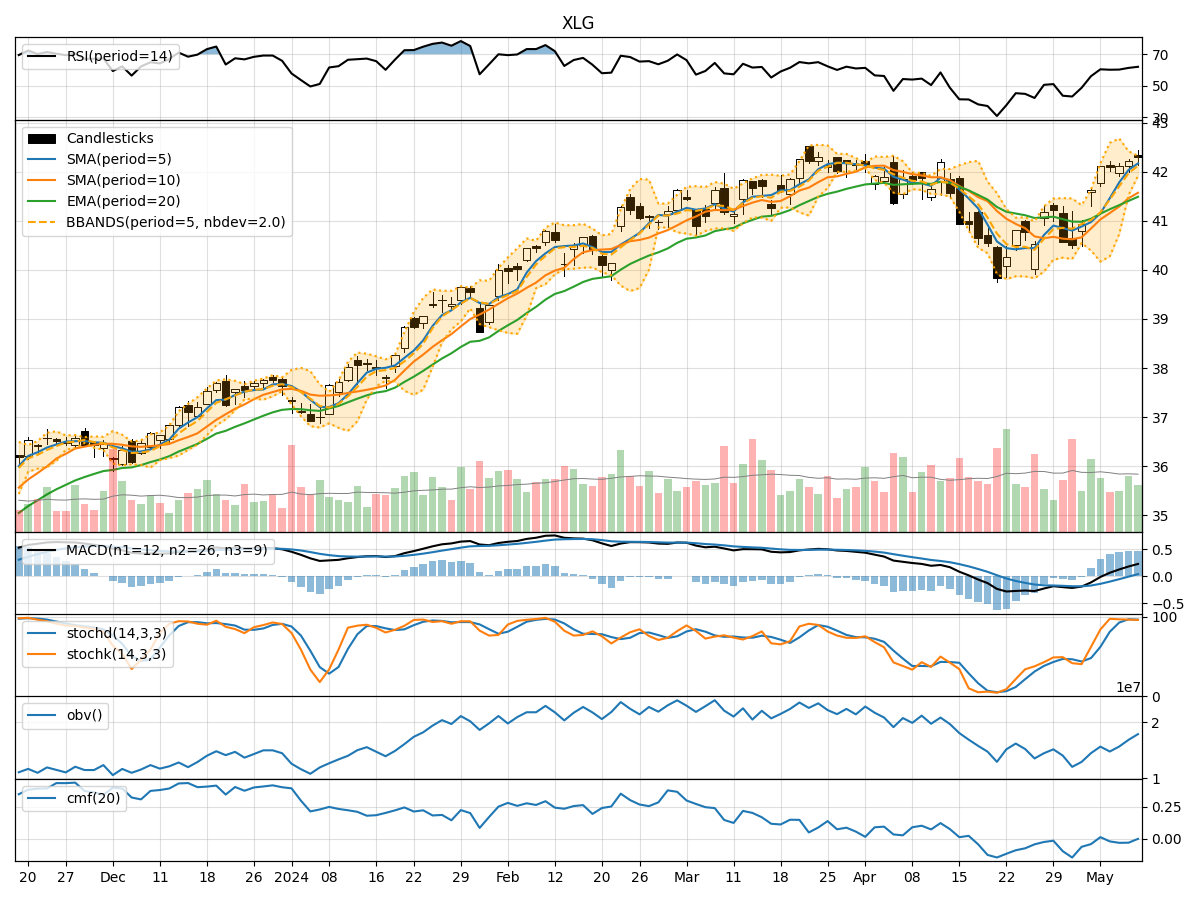
- Moving Averages (MA): The 5-day Moving Average has been consistently above the Simple Moving Average (SMA) and Exponential Moving Average (EMA), indicating a bullish trend.
- MACD: The MACD line has been consistently above the signal line, with both lines showing an upward trend, suggesting bullish momentum.
- MACD Histogram: The MACD Histogram has been increasing over the past 5 days, indicating strengthening bullish momentum.
Momentum Analysis:
- RSI: The Relative Strength Index (RSI) has been in the overbought territory, suggesting a strong bullish momentum.
- Stochastic Oscillator: Both %K and %D lines of the Stochastic Oscillator have been in the overbought zone, indicating a potential reversal or consolidation.
- Williams %R: The Williams %R has been fluctuating in the oversold and overbought zones, signaling potential price reversals.
Volatility Analysis:
- Bollinger Bands: The Bollinger Bands have been widening, indicating increased volatility in the stock price.
- Bollinger %B: The %B indicator has been fluctuating within the bands, suggesting potential price reversals or breakouts.
Volume Analysis:
- On-Balance Volume (OBV): The OBV has shown mixed signals, with some days experiencing selling pressure and others showing accumulation.
- Chaikin Money Flow (CMF): The CMF has been mostly negative, indicating some distribution in the stock.
Key Observations:
- The trend indicators suggest a strong bullish sentiment in the stock.
- Momentum indicators point towards overbought conditions, signaling a potential reversal or consolidation.
- Volatility indicators indicate increased price fluctuations and potential breakouts.
- Volume indicators show mixed signals, with some days indicating selling pressure.
Conclusion:
Based on the analysis of the technical indicators, the next few days for XLG could see further upward movement in the stock price, driven by the strong bullish trend and momentum. However, caution is advised as the stock is currently in overbought territory, and a potential reversal or consolidation phase could be on the horizon. Traders should closely monitor price action, key support and resistance levels, and watch for any signs of a trend reversal.