Technical Analysis of XJUN 2024-05-10
Overview:
In analyzing the technical indicators for XJUN stock over the last 5 days, we will delve into the trends, momentum, volatility, and volume aspects to provide a comprehensive outlook on the possible future stock price movement. By examining key indicators such as moving averages, MACD, RSI, Bollinger Bands, and OBV, we aim to offer valuable insights and predictions for the upcoming trading days.
Trend Analysis:
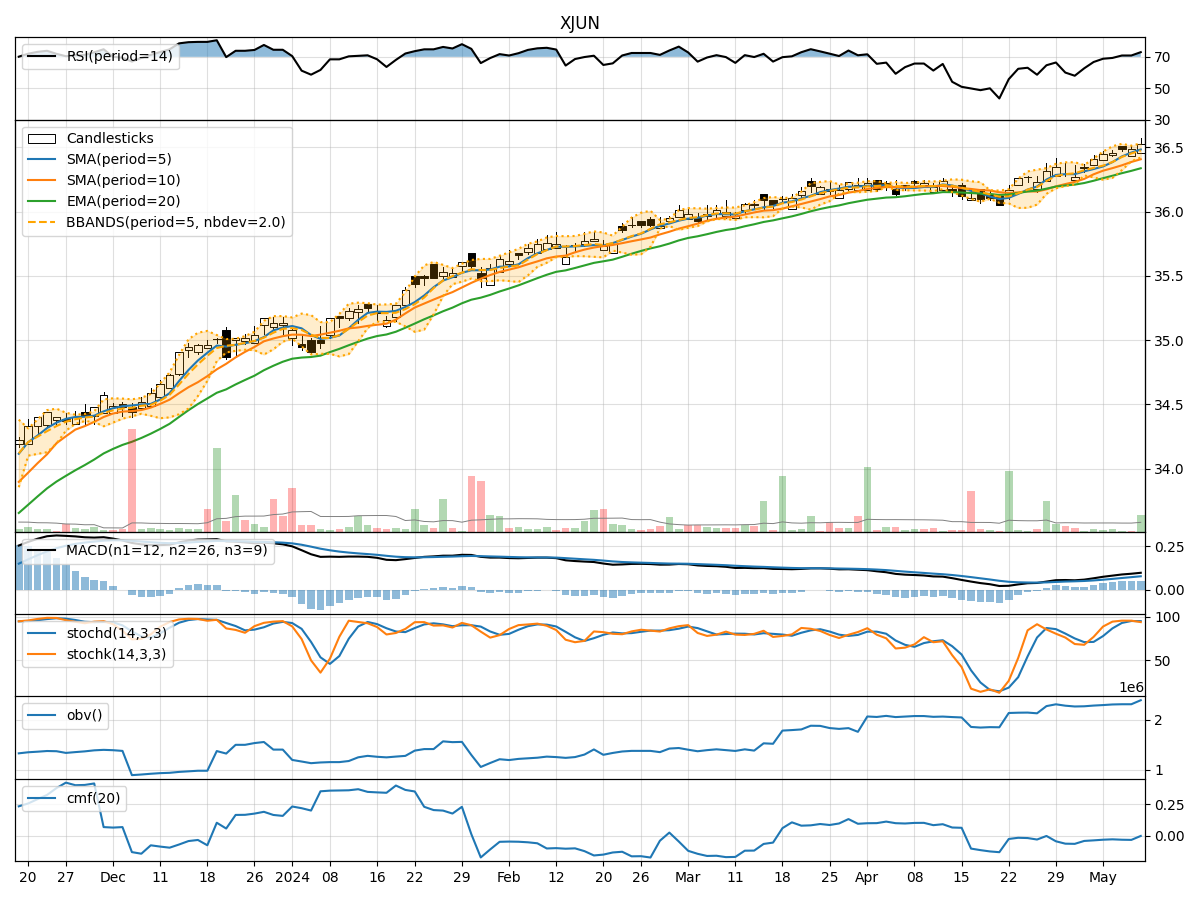
- Moving Averages (MA): The 5-day MA has been consistently above the closing price, indicating a short-term uptrend.
- MACD: The MACD line has been trending upwards, with the MACD histogram showing positive values, suggesting bullish momentum.
Momentum Analysis:
- RSI: The RSI has been in the overbought territory, indicating a strong bullish momentum.
- Stochastic Oscillator: Both %K and %D have been in the overbought zone, signaling a potential reversal or consolidation.
Volatility Analysis:
- Bollinger Bands: The price has been hugging the upper Bollinger Band, suggesting an overbought condition.
Volume Analysis:
- On-Balance Volume (OBV): The OBV has been relatively flat, indicating a lack of significant buying or selling pressure.
Key Observations:
- The stock has shown strong bullish momentum based on RSI and MACD indicators.
- The price is currently in the overbought zone according to the RSI and Stochastic Oscillator.
- Volatility has increased slightly as seen in the Bollinger Bands.
- The OBV has not shown a clear trend, indicating a balance between buying and selling pressure.
Conclusion:
Based on the technical indicators and analysis: - Short-Term View: The stock is currently in an overbought condition, suggesting a potential reversal or consolidation in the near term. - Medium-Term View: The bullish momentum may continue, but caution is advised due to the overbought signals. - Long-Term View: Further confirmation is needed to determine the sustainability of the uptrend.
Recommendation:
- Short-Term Traders: Consider taking profits or setting tight stop-loss orders due to the overbought conditions.
- Medium to Long-Term Investors: Monitor the price action closely for signs of a reversal or consolidation before making significant decisions.
In conclusion, while the stock has exhibited strong bullish momentum, the overbought signals and lack of clear volume trends suggest a potential reversal or consolidation in the short term. It is essential to exercise caution and closely monitor the price action for optimal decision-making.