Technical Analysis of XFEB 2024-05-10
Overview:
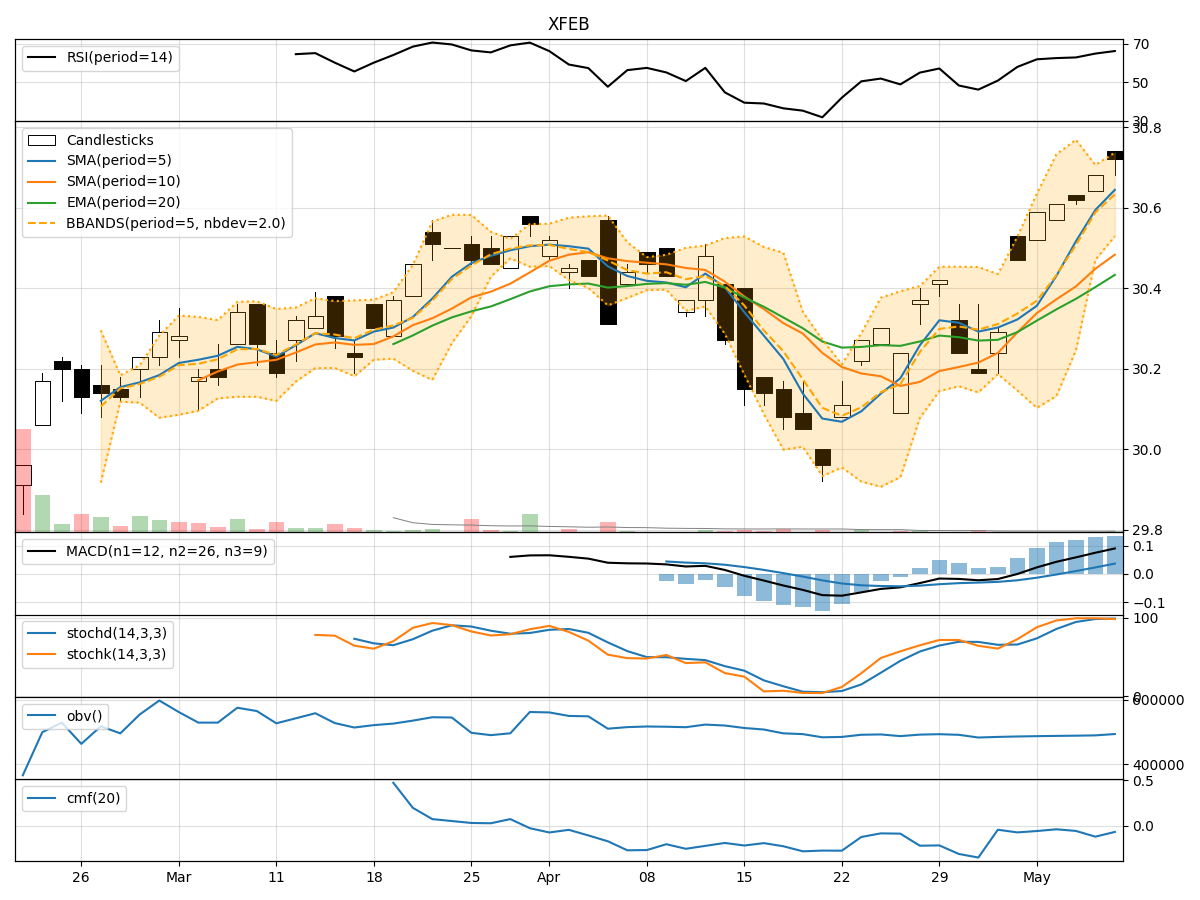
In analyzing the technical indicators for XFEB stock over the last 5 days, we will delve into the trend, momentum, volatility, and volume indicators to provide a comprehensive outlook on the possible stock price movement in the coming days.
Trend Analysis:
- Moving Averages (MA): The 5-day Moving Average (MA) has been consistently above the Simple Moving Average (SMA) and Exponential Moving Average (EMA), indicating a bullish trend.
- MACD: The MACD line has been consistently above the signal line, with both lines showing an upward trend, suggesting bullish momentum.
Momentum Analysis:
- RSI: The Relative Strength Index (RSI) has been gradually increasing and is currently in the overbought territory, indicating strong buying momentum.
- Stochastic Oscillator: Both %K and %D lines of the Stochastic Oscillator are in the overbought zone, suggesting a potential reversal or consolidation.
Volatility Analysis:
- Bollinger Bands (BB): The stock price has been trading within the Bollinger Bands, with the bands narrowing, indicating decreasing volatility.
Volume Analysis:
- On-Balance Volume (OBV): The OBV has been showing a slight increase, indicating accumulation by investors.
- Chaikin Money Flow (CMF): The CMF has been negative, suggesting some selling pressure in the stock.
Key Observations:
- The trend indicators suggest a strong bullish sentiment in the stock.
- Momentum indicators indicate a potential overbought scenario, signaling a caution for further upside.
- Volatility has been decreasing, indicating a possible period of consolidation.
- Volume indicators show a slight increase in buying interest but with some selling pressure.
Conclusion:
Based on the analysis of the technical indicators, the stock price of XFEB is likely to experience some consolidation or a minor pullback in the coming days. The bullish trend may continue, but the overbought momentum and negative CMF signal a need for caution. Traders should watch for potential reversal signals in the Stochastic Oscillator and monitor the OBV for any significant changes in buying or selling pressure.
Recommendation:
- Short-term traders: Consider taking profits or tightening stop-loss levels due to the overbought conditions.
- Long-term investors: Hold positions but monitor the indicators for any signs of a trend reversal.
Disclaimer:
Remember that technical analysis is not a guaranteed predictor of future price movements, and other fundamental factors can influence stock prices. It is essential to conduct thorough research and consider multiple indicators before making any investment decisions. Consulting with a financial advisor is recommended for personalized guidance tailored to your investment goals.