Technical Analysis of XDQQ 2024-05-10
Overview:
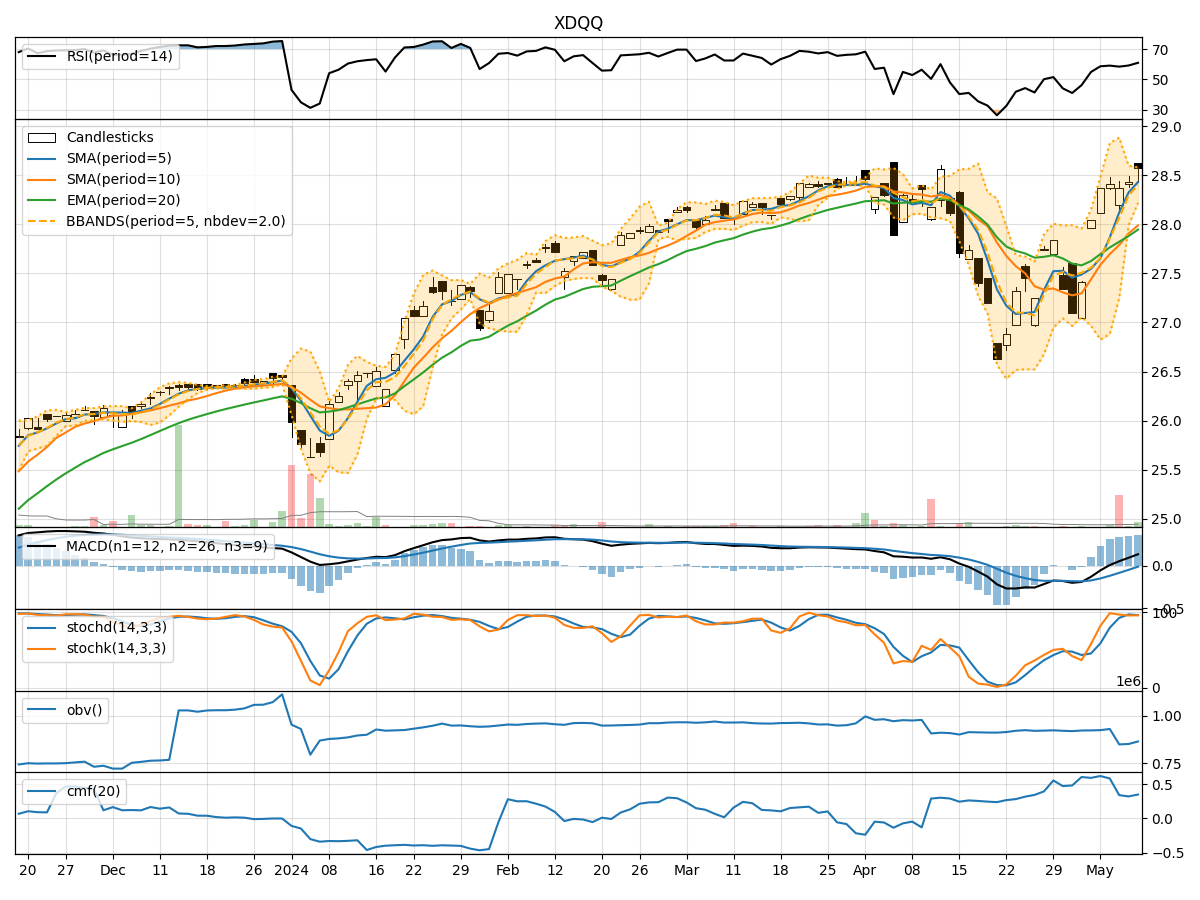
In analyzing the technical indicators for XDQQ over the last 5 days, we will delve into the trend, momentum, volatility, and volume indicators to provide a comprehensive outlook on the possible stock price movement in the coming days.
Trend Analysis:
- Moving Averages (MA): The 5-day MA has been consistently above the closing prices, indicating a bullish trend.
- MACD: The MACD line has been consistently above the signal line, suggesting a bullish momentum.
- EMA: The EMA has been trending upwards, supporting the bullish sentiment.
Momentum Analysis:
- RSI: The RSI has been in the overbought territory, indicating a strong bullish momentum.
- Stochastic Oscillator: Both %K and %D have been in the overbought zone, signaling a potential reversal.
- Williams %R: The indicator has been consistently in the oversold region, suggesting a bullish sentiment.
Volatility Analysis:
- Bollinger Bands (BB): The bands have been narrowing, indicating decreasing volatility.
- BB %B: The %B has been fluctuating around 1, suggesting price is close to the upper band.
- BB Width: The width of the bands has been decreasing, indicating reduced price volatility.
Volume Analysis:
- On-Balance Volume (OBV): The OBV has been declining, indicating selling pressure.
- Chaikin Money Flow (CMF): The CMF has been positive, suggesting buying pressure.
Key Observations:
- The trend indicators suggest a strong bullish sentiment with moving averages and MACD supporting an upward trend.
- Momentum indicators show overbought conditions, indicating a potential reversal or consolidation.
- Volatility indicators point towards decreasing volatility, potentially leading to a period of consolidation.
- Volume indicators reflect a mix of buying and selling pressure, with OBV declining but CMF remaining positive.
Conclusion:
Based on the analysis of the technical indicators, the stock price of XDQQ is likely to experience a short-term consolidation or pullback in the coming days. The overbought conditions in momentum indicators and decreasing volatility signal a potential pause in the current uptrend. Traders may consider taking profits or waiting for a better entry point before considering new long positions. It is essential to monitor the price action closely for any signs of a reversal or continuation of the bullish trend.