Technical Analysis of XBOC 2024-05-10
Overview:
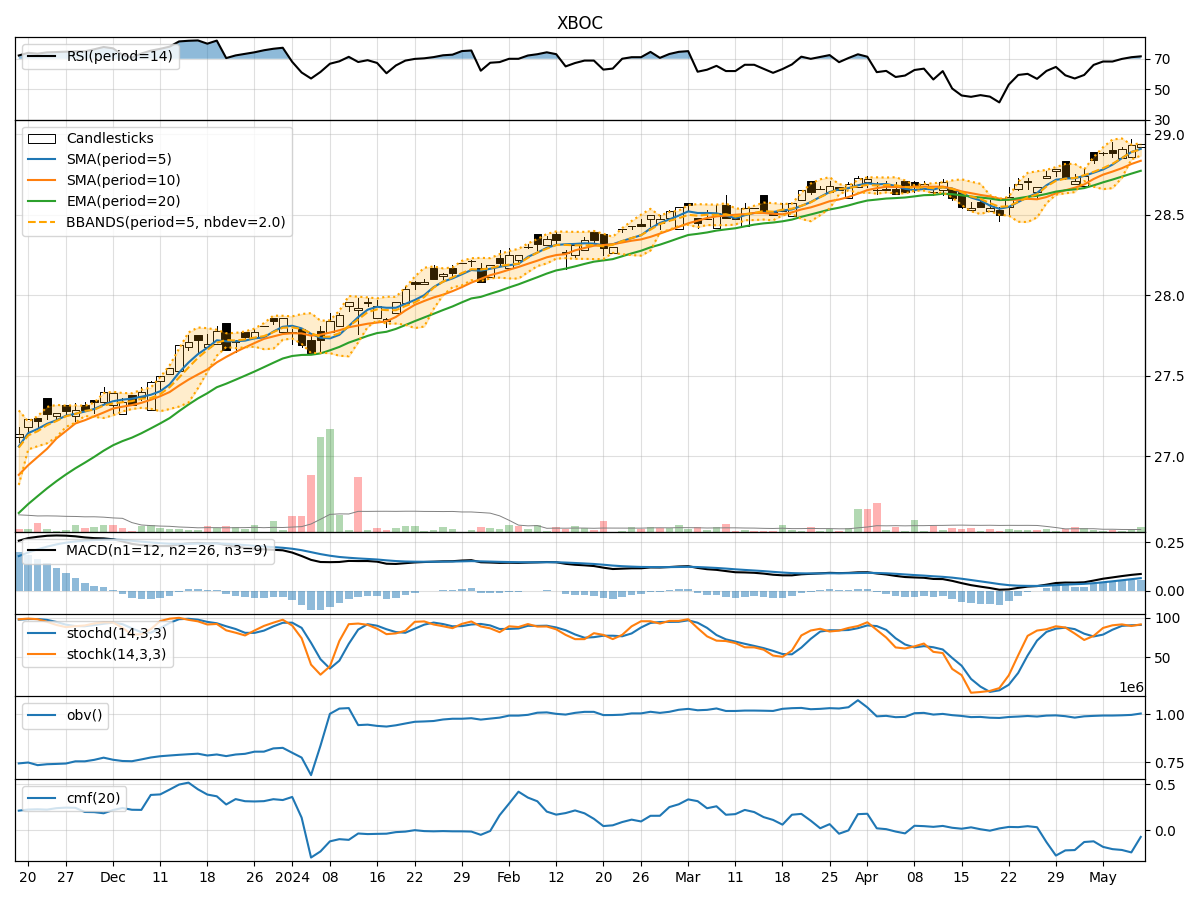
In analyzing the technical indicators for XBOC over the last 5 days, we will delve into the trend, momentum, volatility, and volume indicators to provide a comprehensive outlook on the possible stock price movement. By examining these key aspects, we aim to offer valuable insights and predictions for the upcoming days.
Trend Analysis:
- Moving Averages (MA): The 5-day Moving Average has been steadily increasing, indicating a positive trend in the stock price.
- MACD: The MACD line has been consistently above the signal line, suggesting bullish momentum.
Momentum Analysis:
- RSI: The Relative Strength Index has been trending upwards, showing increasing buying pressure.
- Stochastic Oscillator: Both %K and %D have been in the overbought zone, indicating a strong bullish momentum.
Volatility Analysis:
- Bollinger Bands: The stock price has been trading within the bands, with the %B indicator hovering around 0.8, suggesting a relatively high volatility.
Volume Analysis:
- On-Balance Volume (OBV): The OBV has shown mixed signals, with some days indicating distribution and others accumulation.
- Chaikin Money Flow (CMF): The CMF has been negative, indicating selling pressure in the stock.
Key Observations:
- The trend indicators suggest a bullish sentiment with the moving averages and MACD signaling upward momentum.
- Momentum indicators like RSI and Stochastic Oscillator point towards a strong buying pressure and overbought conditions.
- Volatility remains relatively high as per the Bollinger Bands, indicating potential price swings.
- Volume indicators show mixed signals with OBV reflecting both distribution and accumulation phases.
Conclusion:
Based on the analysis of the technical indicators, the next few days are likely to see a continuation of the bullish trend in XBOC stock. The positive momentum, supported by the moving averages and MACD, suggests further upside potential. However, investors should remain cautious of the high volatility indicated by the Bollinger Bands and monitor the volume closely for any shifts in buying or selling pressure. Overall, the outlook for XBOC stock appears bullish in the near term.