Technical Analysis of XB 2024-05-10
Overview:
In analyzing the technical indicators for the stock XB over the last 5 days, we will delve into the trends, momentum, volatility, and volume indicators to provide a comprehensive outlook on the possible stock price movement in the coming days. By examining these key aspects, we aim to offer valuable insights and predictions to guide your investment decisions.
Trend Indicators:
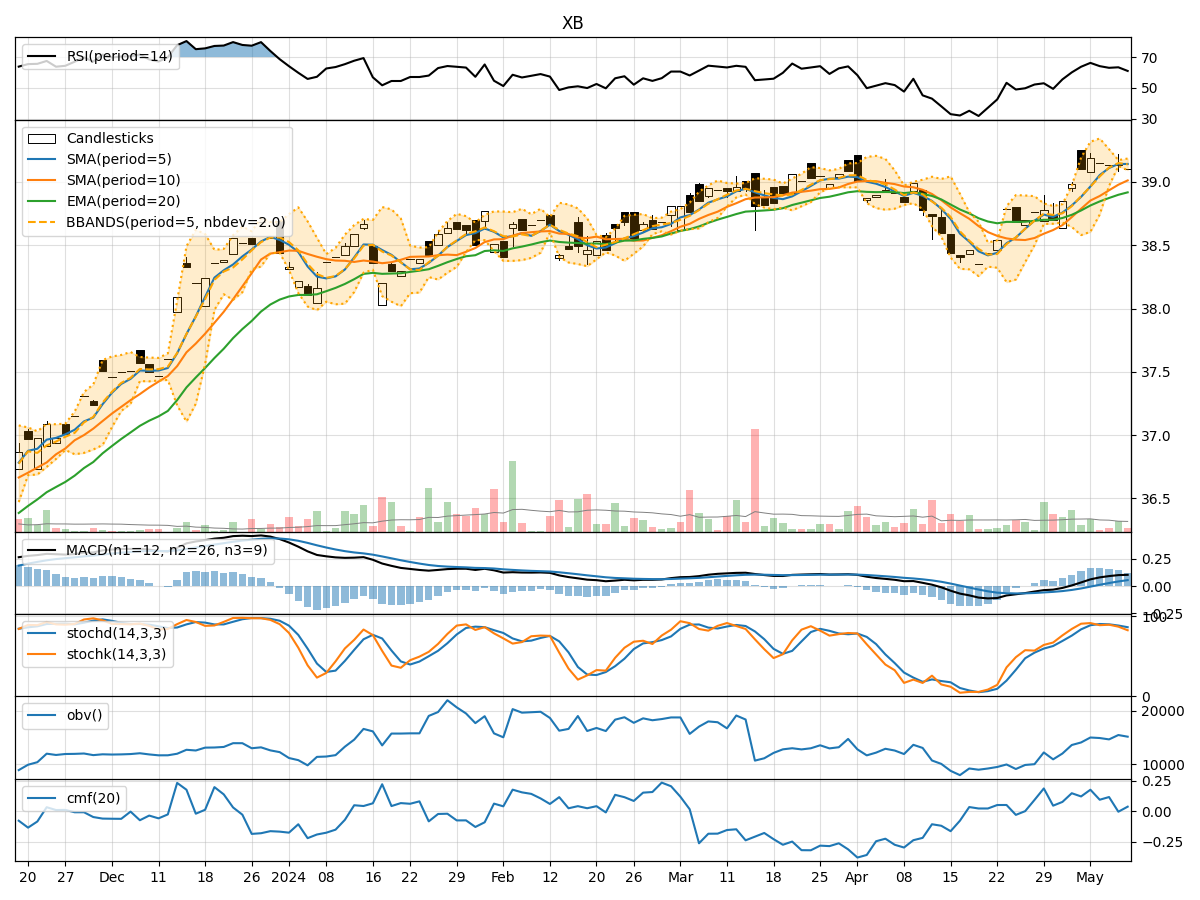
- Moving Averages (MA): The 5-day Moving Average (MA) has been consistently above the Simple Moving Average (SMA) and Exponential Moving Average (EMA), indicating a bullish trend.
- MACD: The MACD line has been consistently above the signal line, with both lines showing an upward trend, suggesting bullish momentum.
- MACD Histogram: The MACD Histogram has been increasing over the past 5 days, indicating strengthening bullish momentum.
Momentum Indicators:
- RSI: The Relative Strength Index (RSI) has been fluctuating around the overbought territory, suggesting a strong bullish momentum.
- Stochastic Oscillator: Both %K and %D lines of the Stochastic Oscillator have been gradually decreasing but remain in the overbought zone, indicating a potential reversal.
- Williams %R: The Williams %R has been in the oversold territory, signaling a potential buying opportunity.
Volatility Indicators:
- Bollinger Bands: The Bollinger Bands have been narrowing, indicating decreasing volatility and a possible period of consolidation.
- Bollinger %B: The %B indicator has been hovering around the middle range, suggesting a balanced market sentiment.
Volume Indicators:
- On-Balance Volume (OBV): The OBV has been fluctuating, indicating mixed buying and selling pressure.
- Chaikin Money Flow (CMF): The CMF has been positive but declining, suggesting weakening buying pressure.
Key Observations and Opinions:
- Trend: The trend indicators point towards a strong bullish sentiment in the short term.
- Momentum: The momentum indicators suggest a potential reversal or consolidation phase in the near future.
- Volatility: Volatility has been decreasing, indicating a possible period of consolidation or sideways movement.
- Volume: The volume indicators show mixed signals, reflecting uncertainty in market participation.
Conclusion:
Based on the analysis of the technical indicators, the next few days' possible stock price movement for XB is likely to experience consolidation or sideways movement. While the trend remains bullish, the momentum indicators hint at a potential reversal, supported by decreasing volatility and mixed volume signals. Traders should exercise caution and closely monitor key support and resistance levels for potential entry or exit points.
Recommendation:
Considering the mixed signals from the indicators, it is advisable to wait for further confirmation before making significant trading decisions. Keep a close eye on price action and key technical levels to navigate potential market fluctuations effectively.