Technical Analysis of WBND 2024-05-10
Overview:
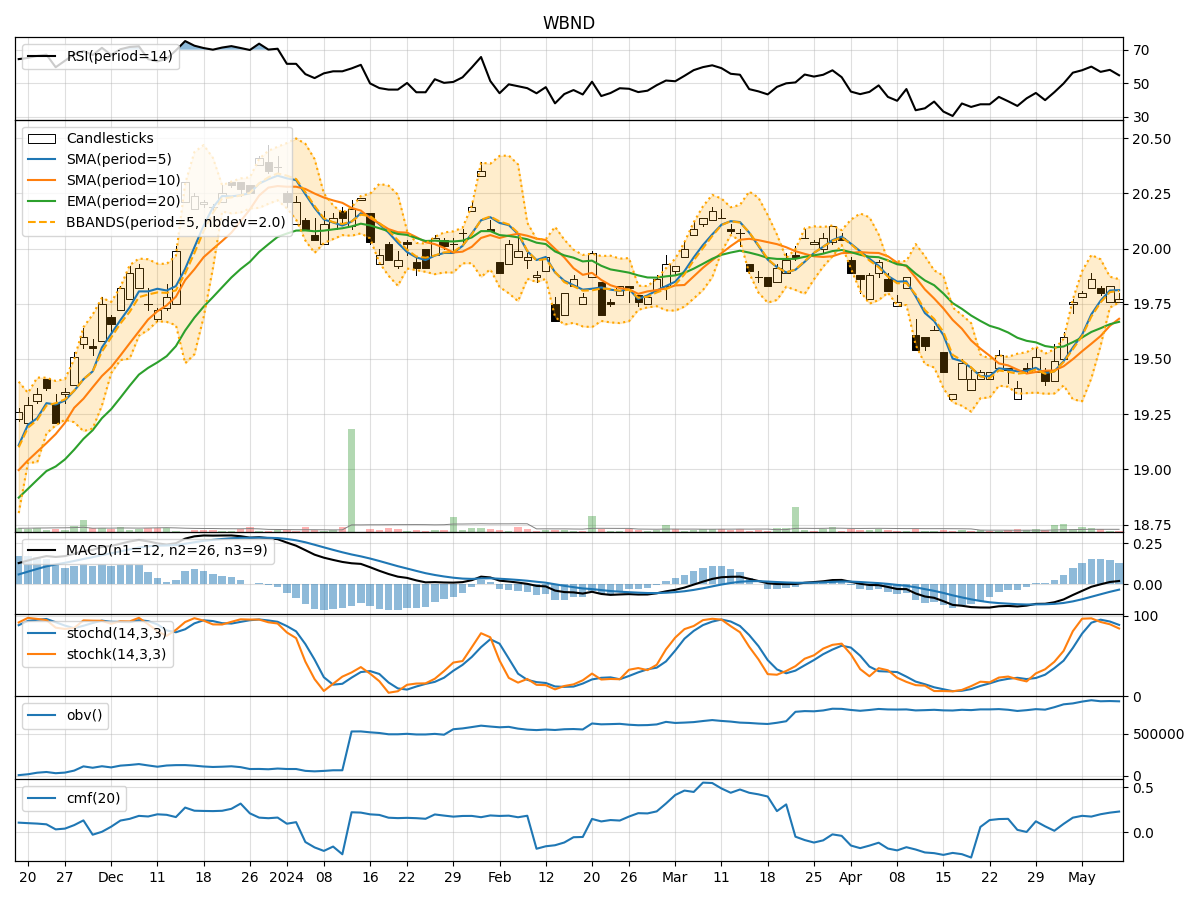
In analyzing the technical indicators for WBND over the last 5 days, we will delve into the trend, momentum, volatility, and volume indicators to provide a comprehensive outlook on the possible stock price movement in the coming days. By examining these key aspects, we aim to offer valuable insights and predictions for potential investors.
Trend Indicators:
- Moving Averages (MA): The 5-day MA has been consistently above the closing prices, indicating a short-term uptrend.
- MACD: The MACD line has been above the signal line, suggesting bullish momentum.
- RSI: The RSI has been fluctuating around the 50 level, indicating a balanced market sentiment.
Momentum Indicators:
- Stochastic Oscillator: The stochastic indicators have been gradually decreasing but remain in the overbought territory.
- Williams %R (WillR): The Williams %R is in the oversold region, signaling a potential reversal.
Volatility Indicators:
- Bollinger Bands (BB): The stock price has been trading within the Bollinger Bands, indicating a period of consolidation.
- BB% (BB Percentage): The BB% is relatively low, suggesting a lack of significant price movement.
Volume Indicators:
- On-Balance Volume (OBV): The OBV has been relatively stable, indicating consistent buying pressure.
- Chaikin Money Flow (CMF): The CMF has been positive, reflecting a healthy inflow of money into the stock.
Key Observations:
- The trend indicators suggest a bullish bias in the short term.
- Momentum indicators show a potential for a minor pullback due to overbought conditions.
- Volatility indicators point towards a period of consolidation.
- Volume indicators indicate steady accumulation of the stock.
Conclusion:
Based on the analysis of the technical indicators, the next few days for WBND are likely to see sideways movement with a slight upward bias. Traders may expect the stock price to consolidate within a range, potentially experiencing minor fluctuations but overall maintaining stability. It is advisable to monitor the stochastic indicators for a potential reversal and the RSI for any shifts in market sentiment. Overall, the outlook remains neutral to slightly bullish in the short term.