Technical Analysis of WABF 2024-05-10
Overview:
In analyzing the technical indicators for WABF over the last 5 days, we will delve into the trend, momentum, volatility, and volume indicators to provide a comprehensive outlook on the possible stock price movement in the coming days. By examining these key aspects, we aim to offer valuable insights and recommendations for potential investors.
Trend Indicators:
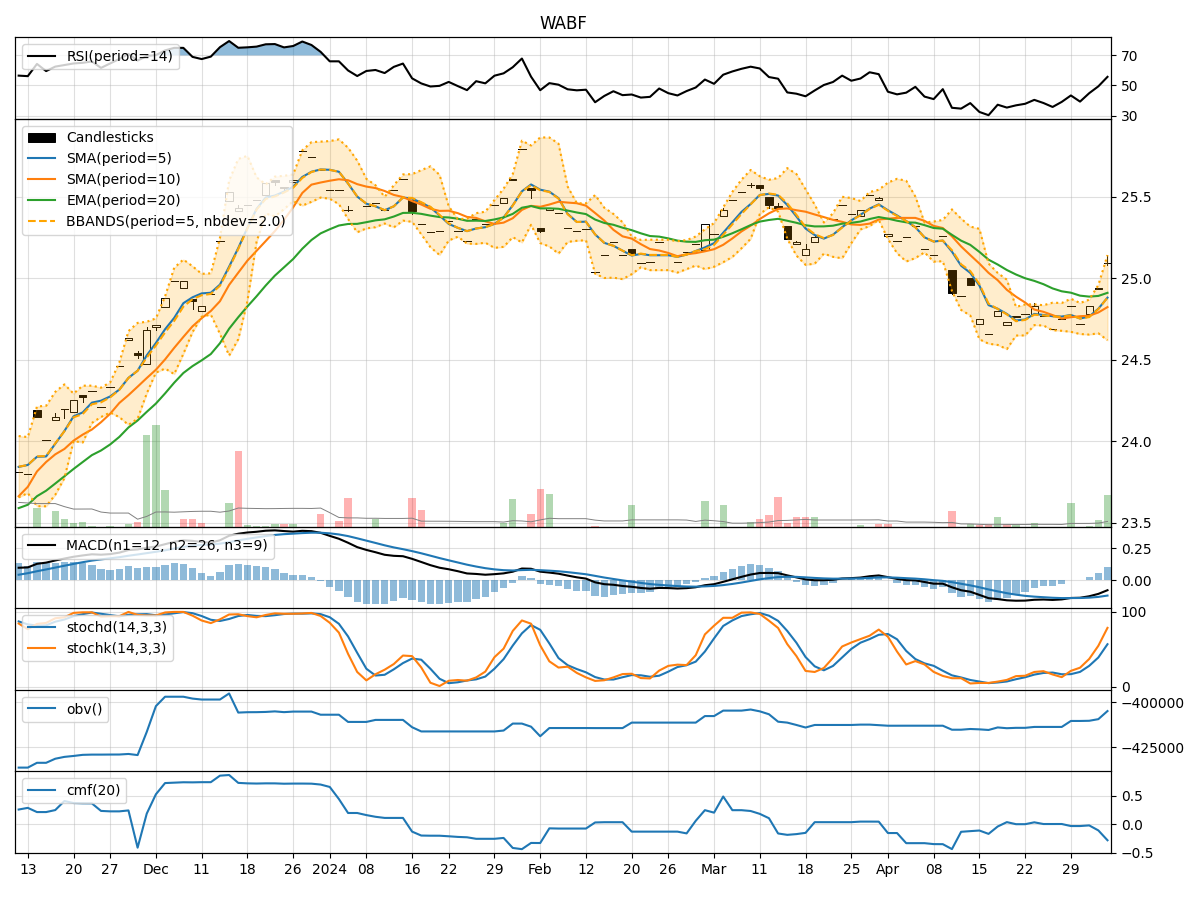
- Moving Averages (MA): The 5-day MA has been consistently above the closing prices, indicating a short-term uptrend.
- MACD: The MACD line has been positive, suggesting bullish momentum.
- RSI: The RSI values have been fluctuating around the neutral zone, indicating indecision in the market sentiment.
Momentum Indicators:
- Stochastic Oscillator: The Stochastic Oscillator has shown overbought conditions, suggesting a potential reversal.
- Williams %R: The Williams %R has been in oversold territory, signaling a possible buying opportunity.
Volatility Indicators:
- Bollinger Bands: The Bollinger Bands have been narrowing, indicating decreasing volatility.
- Average True Range (ATR): ATR values have been relatively stable, suggesting consistent price movements.
Volume Indicators:
- On-Balance Volume (OBV): The OBV has been fluctuating, reflecting mixed buying and selling pressure.
- Chaikin Money Flow (CMF): The CMF has been negative, indicating outflow of money from the stock.
Key Observations and Opinions:
- Trend: The trend indicators suggest a short-term uptrend, supported by positive MACD values.
- Momentum: Mixed signals from the momentum indicators indicate a potential reversal or consolidation phase.
- Volatility: Decreasing volatility as indicated by the narrowing Bollinger Bands may lead to a period of consolidation.
- Volume: Fluctuating OBV and negative CMF values point towards uncertainty in market participation.
Conclusion:
Based on the analysis of the technical indicators, the next few days for WABF could see sideways movement or a slight pullback. The mixed signals from momentum and volume indicators, coupled with decreasing volatility, suggest a period of consolidation or indecision in the market. Investors should exercise caution and closely monitor key support and resistance levels for potential entry or exit points.
Recommendation:
Given the current market dynamics and technical signals, it is advisable to wait for clearer confirmation of the stock's direction before making significant trading decisions. Monitoring key levels and staying informed about any developments that could impact the stock's price movement is crucial for making informed investment choices.