Technical Analysis of VWOB 2024-05-10
Overview:
In analyzing the technical indicators for VWOB over the last 5 days, we will delve into the trend, momentum, volatility, and volume indicators to provide a comprehensive outlook on the possible stock price movement in the coming days. By examining these key aspects, we aim to offer valuable insights and predictions to guide your investment decisions.
Trend Analysis:
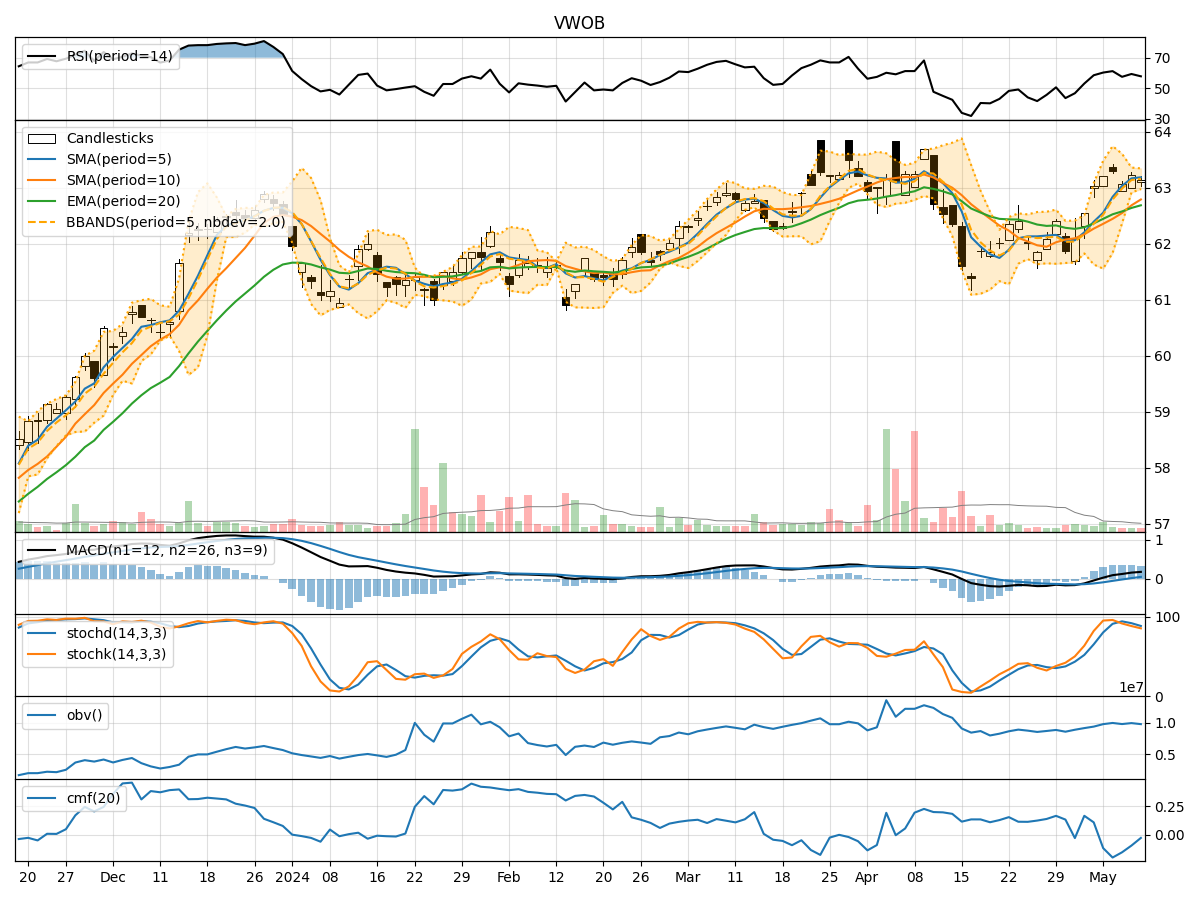
- Moving Averages (MA): The 5-day MA has been consistently above the closing prices, indicating an upward trend in the short term.
- MACD: The MACD line has been positive and increasing, while the MACD histogram has shown a slight decrease in momentum but remains positive, suggesting bullish momentum.
- EMA: The EMA has been trending upwards, supporting the bullish sentiment in the short to medium term.
Momentum Analysis:
- RSI: The RSI has been fluctuating around the overbought territory, indicating strong buying pressure.
- Stochastic Oscillator: Both %K and %D have been in the overbought zone, suggesting a strong bullish momentum.
- Williams %R: The indicator has been consistently in the oversold region, signaling potential buying opportunities.
Volatility Analysis:
- Bollinger Bands (BB): The bands have been narrowing, indicating decreasing volatility and a possible consolidation phase.
- BB %B: The %B indicator has been hovering around the middle, suggesting a neutral stance in terms of volatility.
Volume Analysis:
- On-Balance Volume (OBV): The OBV has been fluctuating, indicating a balance between buying and selling pressure.
- Chaikin Money Flow (CMF): The CMF has been negative, suggesting outflow of money from the stock.
Key Observations:
- The trend indicators point towards a bullish bias in the short to medium term.
- Momentum indicators reflect strong buying pressure and bullish momentum.
- Volatility indicators suggest a potential consolidation phase with decreasing volatility.
- Volume indicators show a balance between buying and selling pressure but with a slight outflow of money.
Conclusion:
Based on the analysis of the technical indicators, the next few days' possible stock price movement for VWOB is likely to be upward with a bullish bias. Investors may consider taking advantage of potential buying opportunities indicated by the momentum indicators. However, it is essential to monitor the volatility for any signs of a breakout or reversal. Overall, the outlook for VWOB appears positive, but caution is advised to manage risks effectively.