Technical Analysis of VV 2024-05-10
Overview:
In analyzing the technical indicators for VV stock over the last 5 days, we will delve into the trend, momentum, volatility, and volume indicators to provide a comprehensive outlook on the possible stock price movement in the coming days. By examining these key aspects, we aim to offer valuable insights and predictions to guide your investment decisions.
Trend Indicators:
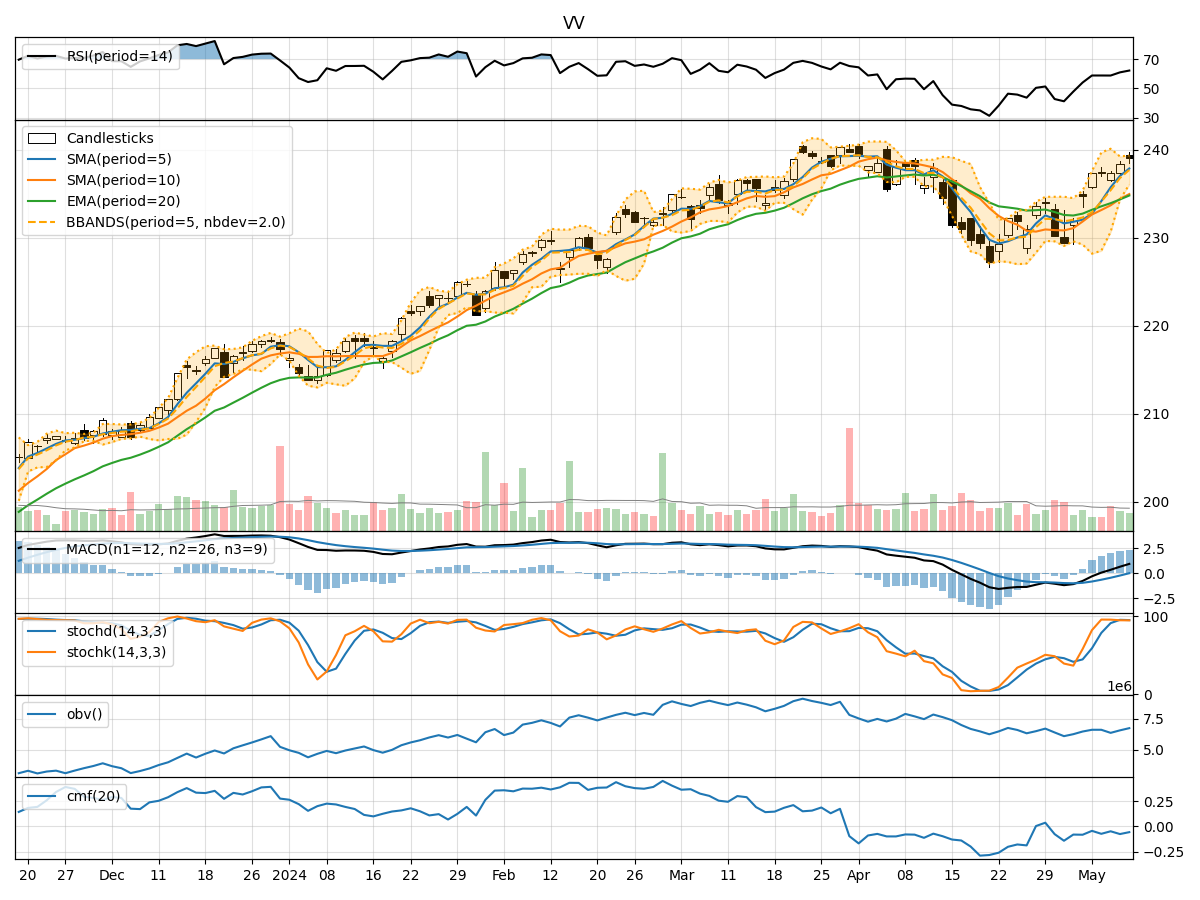
- Moving Averages (MA): The 5-day moving average has been consistently above the 10-day simple moving average, indicating a short-term bullish trend. The exponential moving average (EMA) has also been trending upwards, reflecting positive momentum.
- MACD: The MACD line has been above the signal line for the past few days, suggesting bullish momentum in the stock price.
- Conclusion: The trend indicators point towards an upward trajectory for VV stock.
Momentum Indicators:
- RSI: The Relative Strength Index (RSI) has been increasing, indicating strengthening buying pressure.
- Stochastic Oscillator: Both %K and %D have been in the overbought zone, signaling a potential reversal or consolidation.
- Conclusion: Momentum indicators suggest a bullish sentiment, but caution is advised due to the overbought conditions.
Volatility Indicators:
- Bollinger Bands: The stock price has been trading within the upper Bollinger Band, indicating increased volatility and potential overbought conditions.
- Conclusion: Volatility indicators suggest a high volatility environment, which could lead to sharp price movements in either direction.
Volume Indicators:
- On-Balance Volume (OBV): The OBV has been fluctuating, indicating mixed buying and selling pressure.
- Chaikin Money Flow (CMF): The CMF has been negative, suggesting outflow of money from the stock.
- Conclusion: Volume indicators reflect mixed sentiment with a slight bias towards selling pressure.
Overall Conclusion:
Based on the analysis of trend, momentum, volatility, and volume indicators, the overall outlook for VV stock in the next few days is as follows: - Trend: Upward - Momentum: Bullish with caution due to overbought conditions - Volatility: High, indicating potential for sharp price movements - Volume: Mixed with a slight bias towards selling pressure
Final Recommendation:
Considering the overall analysis, it is likely that VV stock will continue its upward trend in the coming days, supported by bullish momentum. However, investors should exercise caution due to the high volatility and overbought conditions indicated by the indicators. It is advisable to closely monitor the price action and key levels to make informed trading decisions.