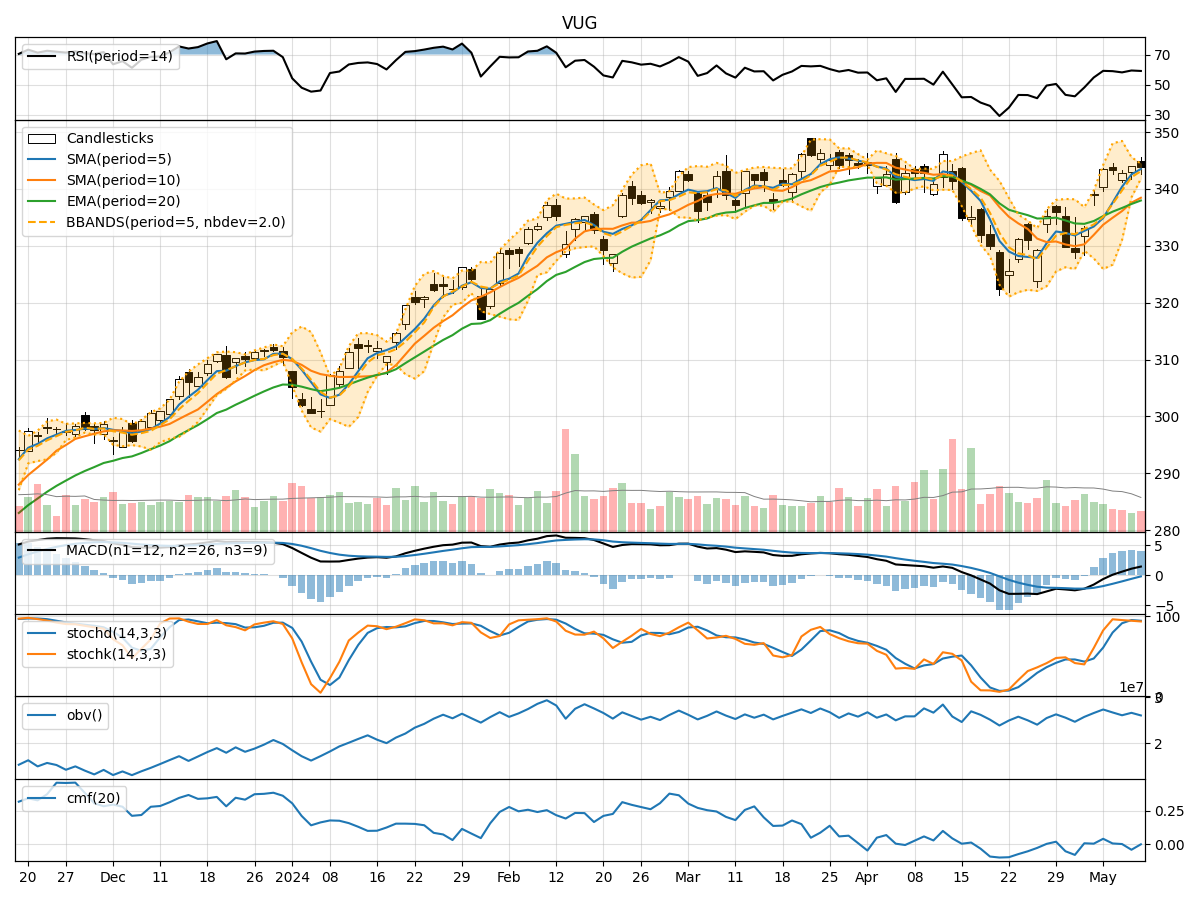
Technical Analysis of VUG 2024-05-10
Overview:
In analyzing the technical indicators for VUG over the last 5 days, we will delve into the trend, momentum, volatility, and volume indicators to provide a comprehensive outlook on the possible stock price movement in the coming days. By examining these key aspects, we aim to offer valuable insights and predictions for informed decision-making.
Trend Analysis:
- Moving Averages (MA): The 5-day Moving Average (MA) has been consistently above the Simple Moving Average (SMA) and Exponential Moving Average (EMA), indicating a bullish trend.
- MACD: The MACD line has been consistently above the signal line, suggesting positive momentum in the stock price.
- Conclusion: The trend indicators point towards an upward trend in the stock price.
Momentum Analysis:
- RSI: The Relative Strength Index (RSI) has been fluctuating around the 50 level, indicating a balanced momentum in the stock.
- Stochastic Oscillator: Both %K and %D have been relatively high, suggesting a strong buying momentum.
- Conclusion: The momentum indicators suggest a neutral to slightly bullish sentiment in the stock.
Volatility Analysis:
- Bollinger Bands (BB): The stock price has been trading within the Bollinger Bands, with the bands narrowing over the last few days, indicating decreasing volatility.
- Conclusion: Volatility indicators signal a decreasing volatility in the stock price.
Volume Analysis:
- On-Balance Volume (OBV): The OBV has been fluctuating, indicating indecision among investors regarding the stock.
- Chaikin Money Flow (CMF): The CMF has been slightly negative, suggesting a slight outflow of money from the stock.
- Conclusion: Volume indicators reflect mixed sentiment among investors.
Conclusion:
Based on the analysis of trend, momentum, volatility, and volume indicators, the overall outlook for VUG in the next few days is as follows: - Trend: The stock is in an upward trend. - Momentum: The momentum is neutral to slightly bullish. - Volatility: Volatility is decreasing. - Volume: Volume indicators show mixed sentiment.
Final Recommendation:
Considering the overall analysis, it is likely that VUG will continue its upward trend in the coming days with reduced volatility. Investors may consider holding or adding to their positions in VUG for potential gains. However, it is essential to monitor the momentum and volume indicators closely for any shifts in market sentiment.