Technical Analysis of VTI 2024-05-03
Overview:
In analyzing the technical indicators for VTI over the last 5 days, we will delve into the trend, momentum, volatility, and volume indicators to provide a comprehensive outlook on the possible stock price movement in the coming days. By examining these key aspects, we aim to offer valuable insights and predictions for informed decision-making.
Trend Indicators:
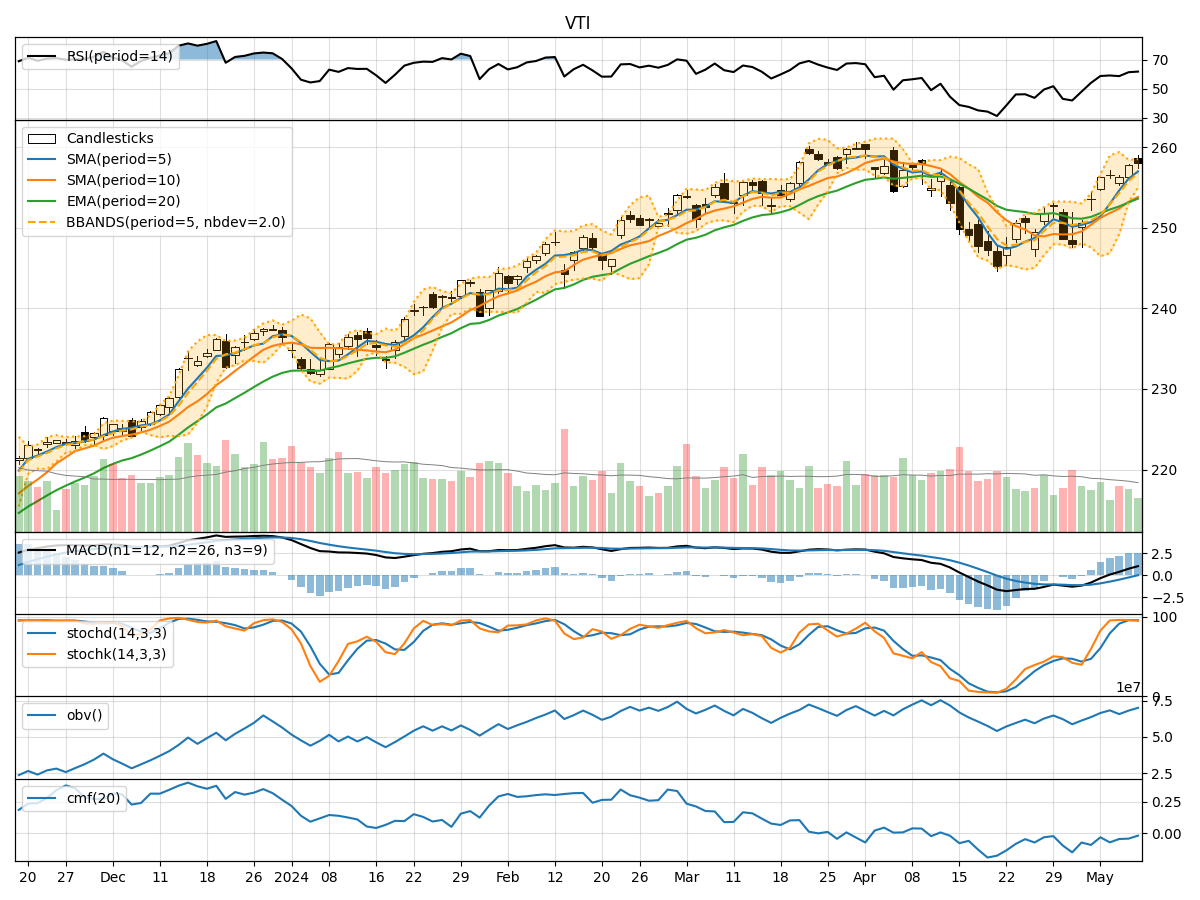
- Moving Averages (MA): The 5-day MA has been fluctuating around the 250 level, indicating a short-term consolidation phase. Both the SMA(10) and EMA(20) are relatively close to the current price, suggesting a balanced trend.
- MACD: The MACD line has been hovering around the signal line, indicating a lack of strong momentum in either direction. The MACD histogram has shown minor fluctuations but remains close to the zero line, reflecting a neutral stance.
Momentum Indicators:
- RSI: The RSI has been oscillating around the 50 level, indicating a lack of strong buying or selling pressure. It has not reached overbought or oversold levels, suggesting a balanced market sentiment.
- Stochastic Oscillator: The Stochastics have shown mixed signals, with the %K line crossing above the %D line on some days and vice versa. This indicates indecision in the market regarding the stock's direction.
Volatility Indicators:
- Bollinger Bands (BB): The Bollinger Bands have shown slight expansion, indicating a potential increase in volatility. The price has touched the upper band, suggesting a short-term overbought condition. However, the bands have not widened significantly to signal a strong trend.
- Bollinger %B: The %B indicator has fluctuated within a narrow range, indicating a lack of clear trend direction. It has not reached extreme levels, suggesting a balanced market sentiment.
Volume Indicators:
- On-Balance Volume (OBV): The OBV has shown a slight decline over the last few days, indicating some distribution of shares. This could suggest weakening buying pressure in the market.
- Chaikin Money Flow (CMF): The CMF has been negative, indicating that money is flowing out of the stock. This aligns with the OBV trend and suggests a bearish sentiment in terms of volume flow.
Conclusion:
Based on the analysis of the technical indicators, the stock price of VTI is likely to experience sideways movement in the coming days. The lack of strong trends in the trend and momentum indicators, coupled with moderate volatility and declining volume indicators, suggests a period of consolidation or indecision in the market. Traders may expect the stock to trade within a range with no clear bias towards either bullish or bearish sentiment. It is advisable to closely monitor key support and resistance levels for potential breakout opportunities.