Technical Analysis of VEA 2024-05-03
Overview:
In analyzing the technical indicators for VEA over the last 5 days, we will delve into the trend, momentum, volatility, and volume indicators to provide a comprehensive outlook on the possible stock price movement in the coming days. By examining these key indicators, we aim to offer valuable insights and predictions for informed decision-making.
Trend Analysis:
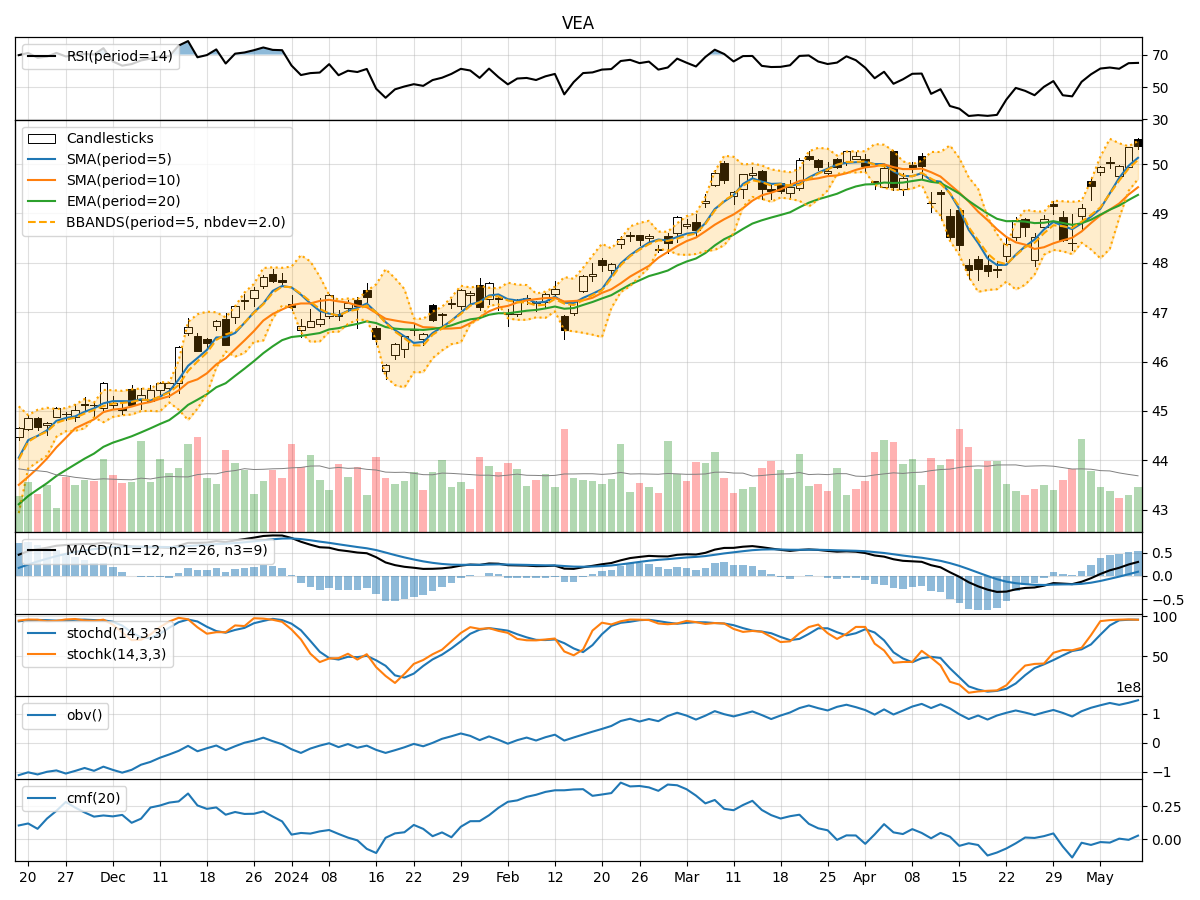
- Moving Averages (MA): The 5-day MA has been fluctuating around the closing prices, indicating short-term price trends. The SMA(10) and EMA(20) have shown a slight upward trend, suggesting potential bullish momentum.
- MACD: The MACD line has been negative but showing signs of convergence towards the signal line, indicating a possible trend reversal.
- MACD Histogram: The histogram has been gradually increasing, signaling a potential shift towards bullish momentum.
Momentum Analysis:
- RSI: The RSI has been fluctuating within the neutral zone, indicating indecision in the market.
- Stochastic Oscillator: Both %K and %D have been rising, reaching overbought levels, suggesting a potential reversal or consolidation.
- Williams %R: The indicator has been hovering near oversold levels, indicating a possible buying opportunity.
Volatility Analysis:
- Bollinger Bands: The price has been trading within the bands, with the upper band expanding, suggesting increased volatility.
- Bollinger %B: The %B indicator has been fluctuating, indicating potential shifts in volatility levels.
Volume Analysis:
- On-Balance Volume (OBV): The OBV has been fluctuating, suggesting mixed sentiment among investors.
- Chaikin Money Flow (CMF): The CMF has been negative, indicating selling pressure in the market.
Key Observations:
- The trend indicators show a potential bullish bias with signs of a trend reversal.
- Momentum indicators suggest a mixed sentiment with overbought and oversold conditions.
- Volatility indicators point towards increased price fluctuations.
- Volume indicators reflect a lack of strong buying or selling pressure.
Conclusion:
Based on the analysis of the technical indicators, the next few days' possible stock price movement for VEA could be sideways with a slight bullish bias. Traders should closely monitor the trend reversal signals from the MACD and the overbought conditions from the stochastic oscillator for potential entry or exit points. Additionally, keeping an eye on the expanding Bollinger Bands for increased volatility levels is crucial. Overall, a cautious approach with a focus on key reversal signals is recommended in the current market scenario.