Technical Analysis of VABS 2024-05-10
Overview:
In analyzing the technical indicators for VABS stock over the last 5 days, we will delve into the trend, momentum, volatility, and volume indicators to provide a comprehensive assessment of the stock's potential price movement. By examining these key aspects, we aim to offer valuable insights and predictions for the next few days.
Trend Analysis:
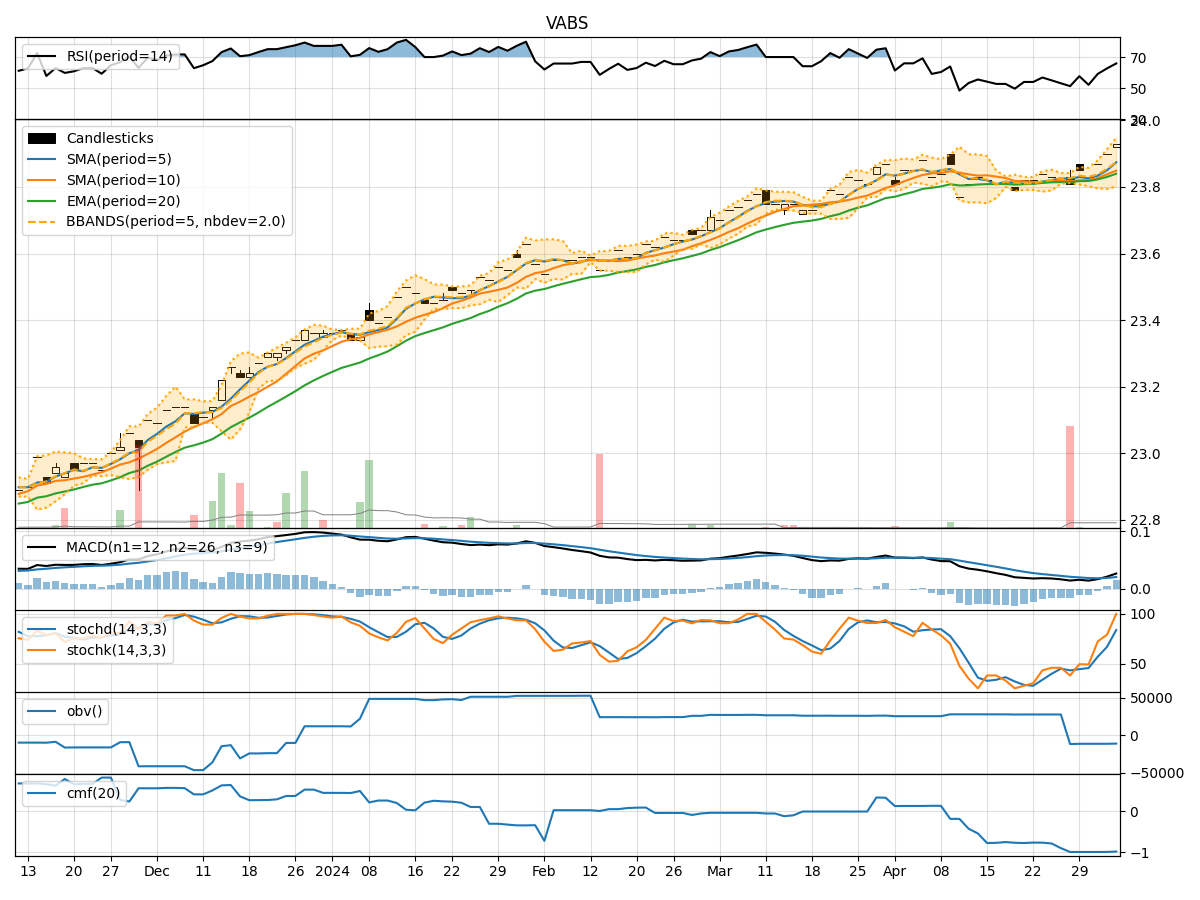
- Moving Averages (MA): The 5-day MA has been consistently above both the simple moving average (SMA) and exponential moving average (EMA) over the past 5 days, indicating a bullish trend.
- MACD: The MACD line has been positive and increasing, while the MACD histogram has also been on an upward trajectory, suggesting bullish momentum.
Momentum Analysis:
- RSI: The Relative Strength Index (RSI) has been in the overbought territory, indicating a strong bullish momentum.
- Stochastic Oscillator: Both %K and %D have been consistently high, signaling strong buying pressure.
Volatility Analysis:
- Bollinger Bands (BB): The stock price has been trading within the upper Bollinger Band, indicating an increased volatility but also potential overbought conditions.
Volume Analysis:
- On-Balance Volume (OBV): The OBV has been relatively flat, suggesting a lack of significant volume accumulation despite the price increase.
- Chaikin Money Flow (CMF): The CMF has been negative, indicating a bearish money flow trend.
Key Observations:
- The stock is currently in a strong bullish trend based on moving averages and MACD.
- Momentum indicators like RSI and Stochastic Oscillator suggest strong buying pressure.
- Volatility is increasing, as seen in the upper Bollinger Band, but caution is warranted due to potential overbought conditions.
- Volume indicators show a lack of significant volume accumulation despite the price increase, which could be a concern for the sustainability of the uptrend.
Conclusion:
Based on the analysis of the technical indicators, the stock is likely to continue its upward movement in the next few days. The strong bullish trend, supported by momentum indicators and increasing volatility, indicates potential for further price appreciation. However, caution is advised due to the overbought conditions and the lack of significant volume support. Traders should closely monitor the price action and consider taking profits or implementing risk management strategies to navigate potential market corrections.