Technical Analysis of USVN 2024-05-10
Overview:
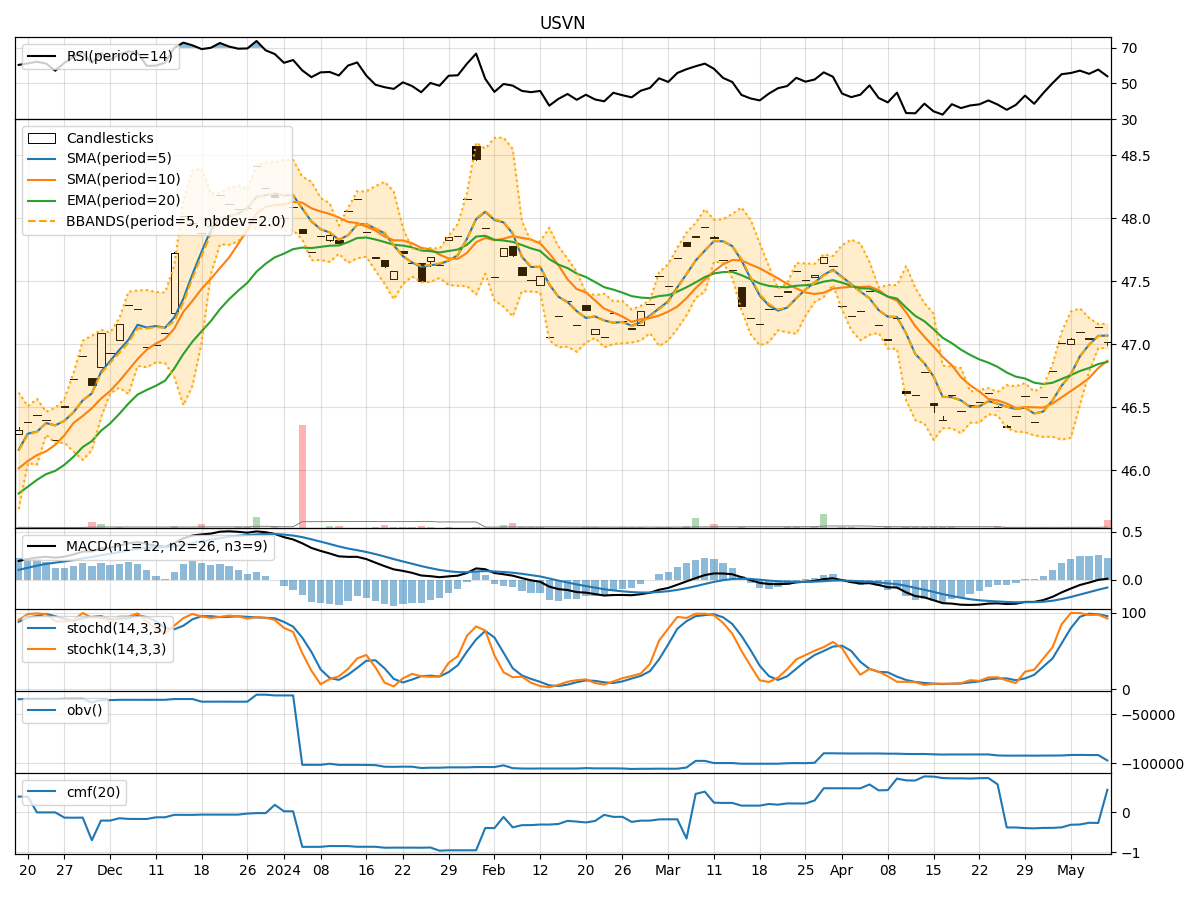
In the last 5 trading days, USVN stock has shown mixed signals across various technical indicators. The trend indicators suggest a slightly bullish sentiment, with the moving averages trending upwards. Momentum indicators indicate a neutral to slightly bearish momentum, while volatility indicators show a decreasing trend in volatility. Volume indicators also reflect a mixed sentiment, with the On-Balance Volume (OBV) showing a slight decrease and the Chaikin Money Flow (CMF) indicating a positive trend.
Trend Indicators:
- Moving Averages (MA): The 5-day MA is above the 10-day SMA, indicating a short-term bullish trend. The EMA(20) is also showing an upward trend, supporting a bullish sentiment.
- MACD: The MACD line is positive, but the MACD Histogram is decreasing, suggesting a potential weakening of the bullish momentum.
- RSI: The RSI is in the neutral zone, indicating a balanced market sentiment.
Momentum Indicators:
- Stochastic Oscillator: The Stochastic Oscillator is in the overbought zone, suggesting a potential reversal or consolidation.
- Williams %R: The Williams %R is in the oversold zone, indicating a possible buying opportunity.
Volatility Indicators:
- Bollinger Bands (BB): The Bollinger Bands are narrowing, indicating decreasing volatility and a potential upcoming breakout.
- BB %B: The %B is below 1, suggesting a possible oversold condition.
Volume Indicators:
- On-Balance Volume (OBV): The OBV is slightly decreasing, indicating a potential distribution phase.
- Chaikin Money Flow (CMF): The CMF is positive, suggesting a bullish money flow into the stock.
Key Observations:
- The trend indicators show a bullish bias, supported by the moving averages and EMA.
- Momentum indicators suggest a neutral to slightly bearish momentum, with potential for a reversal.
- Volatility indicators indicate decreasing volatility, possibly leading to a breakout.
- Volume indicators reflect a mixed sentiment, with a slight decrease in OBV but positive CMF.
Conclusion:
Based on the analysis of the technical indicators, the next few days' possible stock price movement for USVN is likely to be sideways with a slight bullish bias. Traders should watch for a potential breakout as volatility decreases, and monitor the Stochastic Oscillator and Williams %R for potential reversal signals. The overall trend remains slightly bullish, but caution is advised due to the mixed signals from momentum and volume indicators.