Technical Analysis of USSH 2024-05-10
Overview:
In analyzing the technical indicators for USSH stock over the last 5 days, we will delve into the trend, momentum, volatility, and volume indicators to provide a comprehensive outlook on the possible stock price movement in the coming days. By examining these key indicators, we aim to offer valuable insights and recommendations for potential investors.
Trend Indicators:
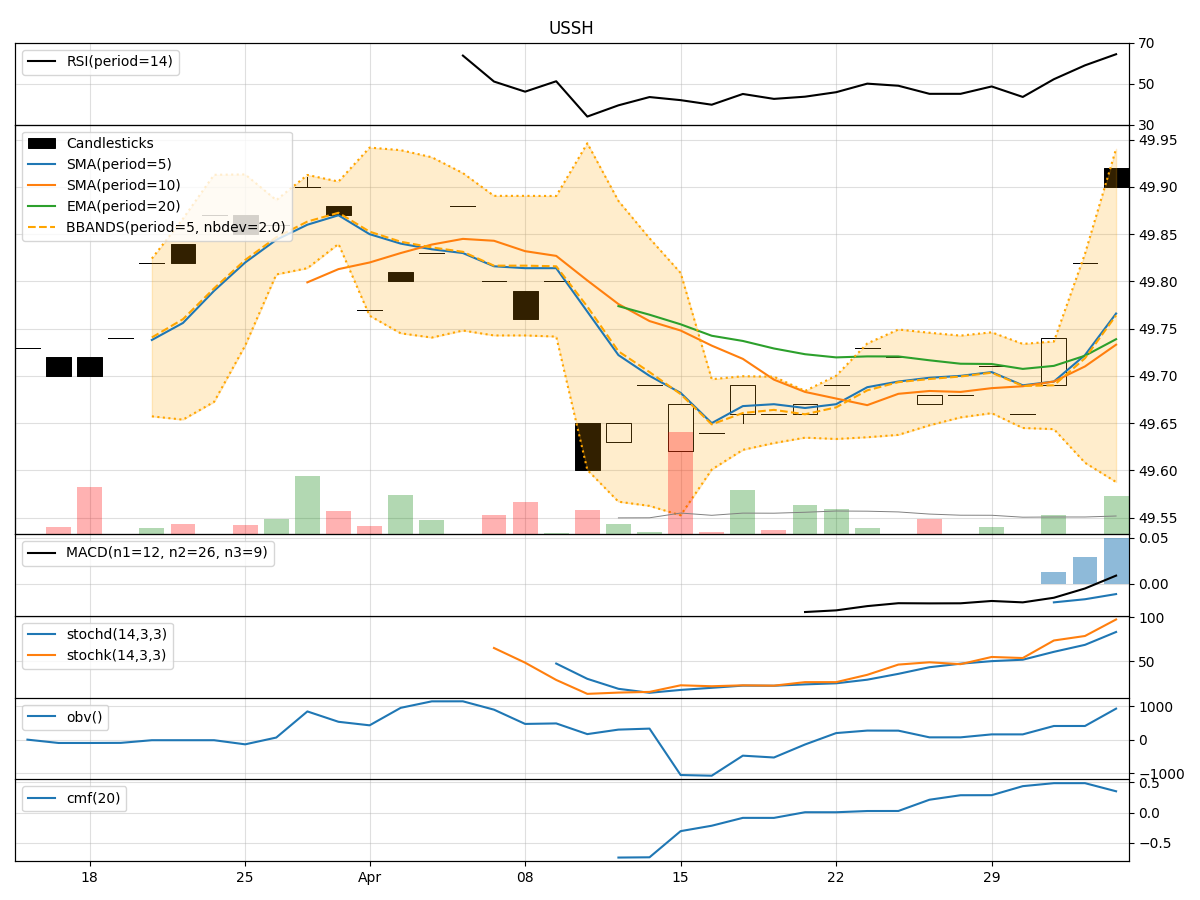
- Moving Averages (MA): The 5-day MA has been consistently above the simple moving average (SMA) and exponential moving average (EMA), indicating a short-term uptrend.
- MACD: The MACD line has been above the signal line, with both lines showing a positive trend, suggesting bullish momentum.
- MACD Histogram: The histogram has been increasing, indicating strengthening bullish momentum.
Momentum Indicators:
- RSI: The RSI has been fluctuating around the 60-70 range, indicating a neutral stance in momentum.
- Stochastic Oscillator: Both %K and %D have been in the overbought zone, suggesting a potential reversal or consolidation.
- Williams %R: The indicator has been hovering in the oversold territory, signaling a possible buying opportunity.
Volatility Indicators:
- Bollinger Bands (BB): The stock price has been trading within the bands, with no significant breaches, indicating stable volatility.
- Bollinger %B: The %B has been fluctuating around the midline, suggesting a balanced market sentiment.
Volume Indicators:
- On-Balance Volume (OBV): The OBV has been relatively flat, indicating no significant accumulation or distribution.
- Chaikin Money Flow (CMF): The CMF has been positive but not showing strong buying pressure.
Key Observations and Opinions:
- Trend: The trend indicators suggest a bullish bias in the short term.
- Momentum: Momentum indicators show mixed signals, with RSI neutral, Stochastic overbought, and Williams %R oversold.
- Volatility: Volatility remains stable, with no extreme movements in price.
- Volume: Volume indicators do not show significant buying or selling pressure.
Conclusion:
Based on the analysis of the technical indicators, the USSH stock is likely to experience sideways consolidation in the coming days. While the trend indicators point to a bullish bias, the mixed signals from momentum indicators and lack of significant volume support suggest a period of consolidation. Investors should closely monitor key support and resistance levels for potential breakout or breakdown scenarios.