Technical Analysis of USIG 2024-05-10
Overview:
In analyzing the technical indicators for the USIG stock over the last 5 days, we will delve into the trend, momentum, volatility, and volume indicators to provide a comprehensive assessment of the stock's potential price movement. By examining these key factors, we aim to offer valuable insights and predictions for the next few days.
Trend Indicators:
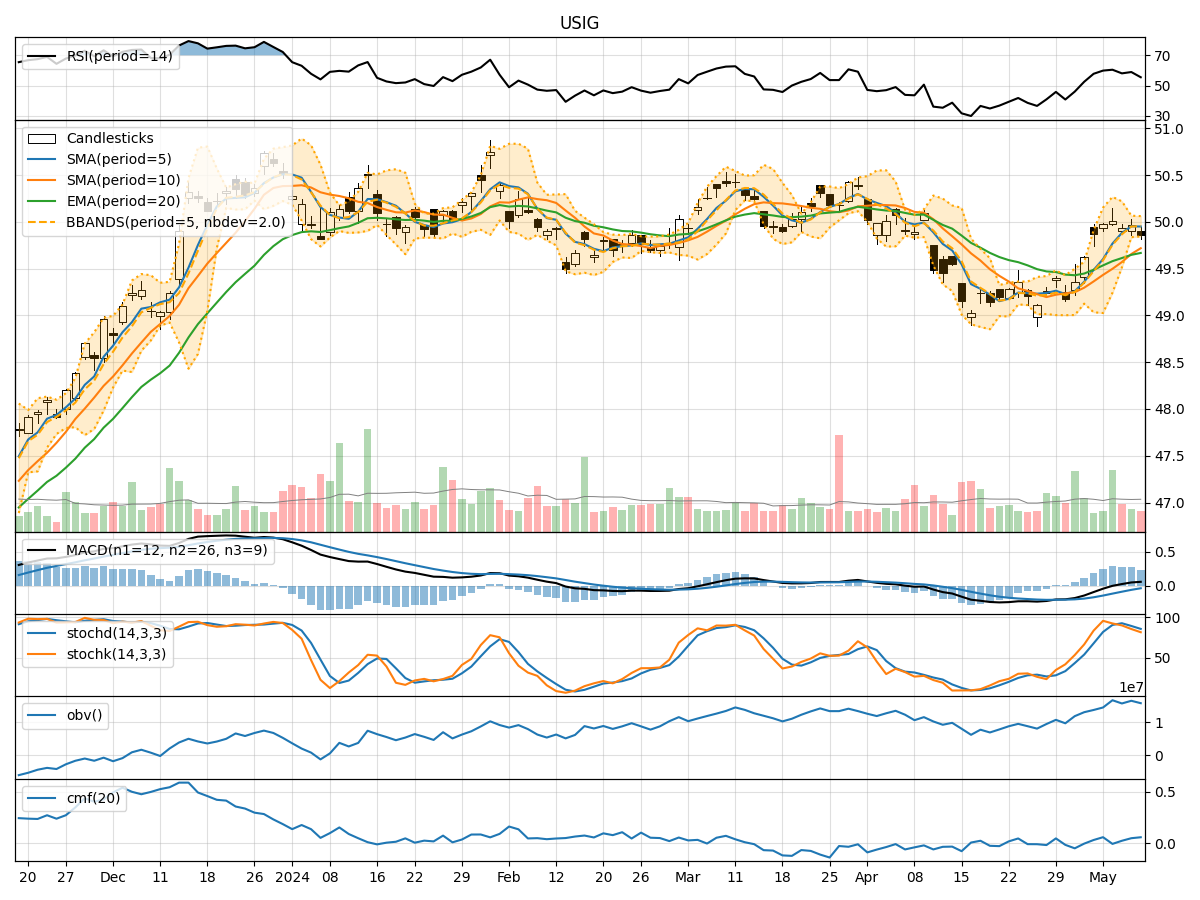
- Moving Averages (MA): The 5-day Moving Average (MA) has been consistently above the Simple Moving Average (SMA) and Exponential Moving Average (EMA), indicating a bullish trend.
- MACD: The Moving Average Convergence Divergence (MACD) has been positive, with the MACD line consistently above the Signal line, suggesting bullish momentum.
- MACD Histogram: The MACD Histogram has been increasing, indicating strengthening bullish momentum.
Momentum Indicators:
- RSI: The Relative Strength Index (RSI) has been fluctuating around the 50 level, suggesting a neutral momentum.
- Stochastic Oscillator: Both %K and %D lines of the Stochastic Oscillator have been declining, indicating a potential bearish momentum shift.
- Williams %R: The Williams %R is in the oversold territory, signaling a potential reversal to the upside.
Volatility Indicators:
- Bollinger Bands: The Bollinger Bands have been narrowing, indicating decreasing volatility and a potential price breakout.
- Bollinger %B: The %B indicator is hovering around the middle band, suggesting a period of consolidation.
- Average True Range (ATR): The ATR has been decreasing, indicating lower volatility in the stock.
Volume Indicators:
- On-Balance Volume (OBV): The OBV has been fluctuating, suggesting indecision among market participants.
- Chaikin Money Flow (CMF): The CMF has been positive, indicating buying pressure in the stock.
Key Observations and Opinions:
- Trend: The stock is currently in an upward trend based on the moving averages and MACD indicators.
- Momentum: Momentum indicators are mixed, with RSI neutral, Stochastic showing a potential bearish signal, and Williams %R indicating oversold conditions.
- Volatility: Volatility has been decreasing, suggesting a period of consolidation and a potential breakout.
- Volume: Volume indicators are inconclusive, with OBV fluctuating and CMF showing buying pressure.
Conclusion:
Based on the analysis of the technical indicators, the next few days for USIG stock could see sideways consolidation with a potential bullish breakout. Traders should monitor the Stochastic oscillator for a potential reversal signal and watch for a breakout above the Bollinger Bands for a confirmation of bullish momentum. It is essential to consider risk management strategies and closely monitor key levels for potential entry or exit points.