Technical Analysis of USEP 2024-05-10
Overview:
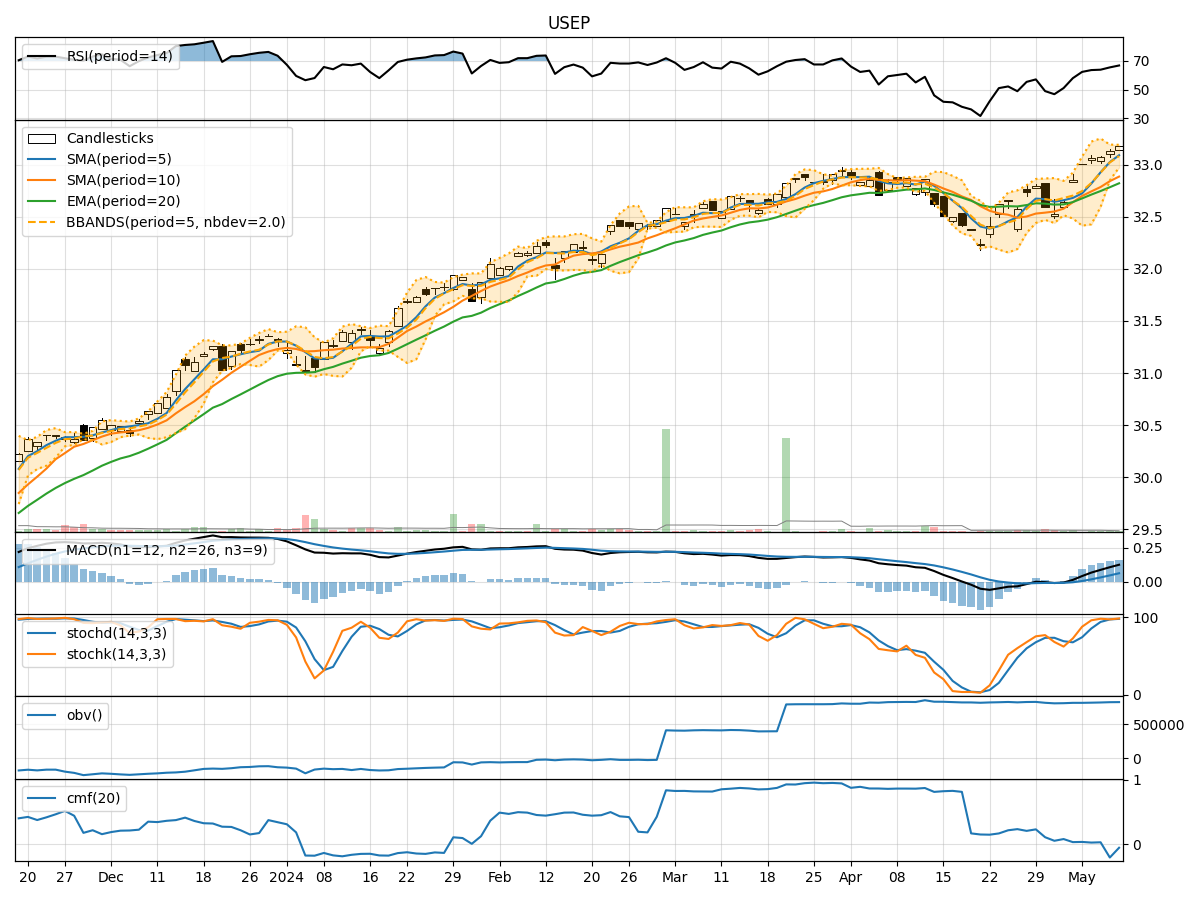
In the last 5 trading days, USEP stock has shown a consistent uptrend in both price and volume. The moving averages have been trending upwards, indicating a positive momentum. Momentum indicators such as RSI, Stochastic Oscillator, and Williams %R suggest that the stock is in overbought territory but still showing strength. Volatility indicators like Bollinger Bands show a narrowing range, while volume indicators like On-Balance Volume (OBV) and Chaikin Money Flow (CMF) have been relatively stable.
Trend Analysis:
- Moving Averages (MA): The 5-day MA has been consistently above the 10-day SMA, indicating a short-term bullish trend. The EMA(20) has also been trending upwards, supporting the bullish sentiment.
- MACD: The MACD line has been above the signal line for the past 5 days, indicating a bullish trend. The MACD Histogram has been increasing, showing strengthening bullish momentum.
Momentum Analysis:
- RSI: The RSI has been in the overbought zone above 70 for the past few days, indicating a strong bullish momentum. However, it also suggests a potential reversal or correction in the near future.
- Stochastic Oscillator: Both %K and %D lines are in the overbought region, signaling a strong bullish momentum that might be due for a pullback.
- Williams %R: The indicator has been consistently in the overbought territory, suggesting a potential reversal or consolidation.
Volatility Analysis:
- Bollinger Bands: The bands have been narrowing, indicating decreasing volatility and a possible period of consolidation. The price is currently trading near the upper band, which could signal a short-term overbought condition.
Volume Analysis:
- On-Balance Volume (OBV): The OBV has been relatively stable over the past 5 days, showing a consistent accumulation of volume. This is a positive sign supporting the uptrend.
- Chaikin Money Flow (CMF): The CMF has been positive but showing a slight decline, indicating some selling pressure. However, it is still above zero, suggesting overall buying pressure.
Conclusion:
Based on the technical analysis of the trend, momentum, volatility, and volume indicators, the stock is currently in a strong bullish trend. However, given the overbought conditions indicated by various momentum indicators, there might be a potential for a short-term correction or consolidation in the coming days. Traders should watch for signs of a reversal, such as a break below key support levels or a divergence in momentum indicators. Long-term investors can consider holding their positions with a close eye on the indicators for any signs of a trend reversal.