Technical Analysis of USD 2024-05-10
Overview:
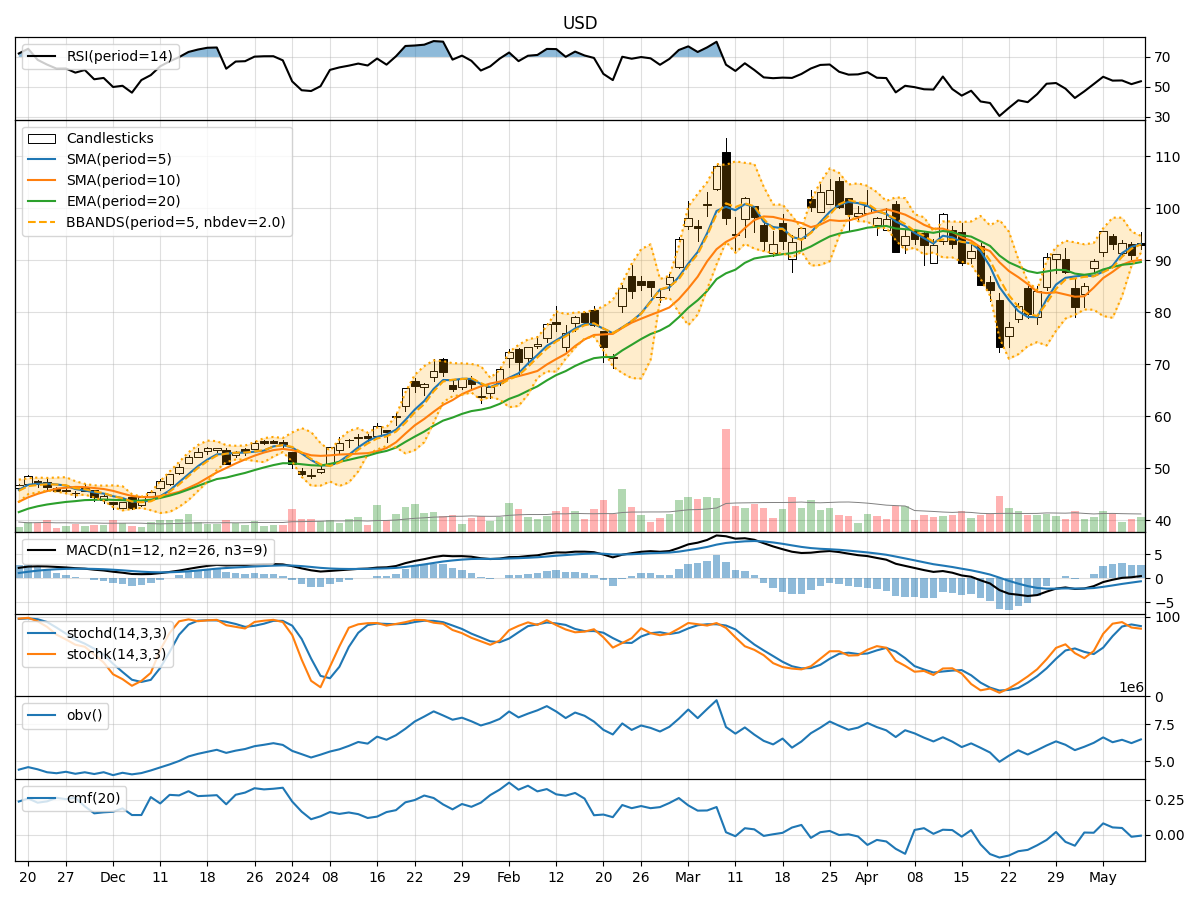
In the last 5 trading days, the USD stock has shown mixed signals across various technical indicators. The stock price has fluctuated within a range, with some indicators suggesting bullish momentum while others indicating potential weakness. By analyzing the trend, momentum, volatility, and volume indicators, we can gain a comprehensive understanding of the stock's potential future price movement.
Trend Indicators:
- Moving Averages (MA): The 5-day MA has been consistently above the stock's closing price, indicating a short-term bullish trend.
- MACD: The MACD line has been positive, suggesting bullish momentum, but the MACD Histogram has been decreasing, indicating a potential weakening of the uptrend.
- Conclusion: The trend indicators show a mixed signal with a slight bullish bias but with signs of potential weakness.
Momentum Indicators:
- RSI: The RSI has been fluctuating around the neutral level of 50, indicating indecision in the market.
- Stochastic Oscillator: The Stochastic indicators have been in overbought territory, suggesting a potential reversal in the short term.
- Conclusion: Momentum indicators are mixed, with no clear direction indicated.
Volatility Indicators:
- Bollinger Bands (BB): The Bollinger Bands have been narrowing, indicating decreasing volatility.
- Conclusion: Volatility has been decreasing, which could lead to a period of consolidation or a breakout in the near future.
Volume Indicators:
- On-Balance Volume (OBV): The OBV has been fluctuating, indicating uncertainty in the buying and selling pressure.
- Chaikin Money Flow (CMF): The CMF has been positive but decreasing, suggesting weakening buying pressure.
- Conclusion: Volume indicators show mixed signals, with no clear confirmation of market sentiment.
Overall Conclusion:
Based on the analysis of the technical indicators, the next few days' possible stock price movement for USD is likely to be sideways with a slight bearish bias. The trend indicators show a mild bullish sentiment, but the momentum, volatility, and volume indicators do not provide a strong confirmation of a sustained upward movement. The narrowing Bollinger Bands and mixed volume signals indicate a period of consolidation or a potential pullback in the stock price.
Recommendation:
- Short-term Traders: Consider staying cautious and monitoring the stock closely for any signs of a clear trend reversal.
- Long-term Investors: Evaluate the fundamental factors of the company in addition to technical indicators before making any investment decisions.
- Risk Management: Implement appropriate stop-loss strategies to protect against potential downside risks.
Always remember to conduct your own research and consider multiple factors before making any investment decisions.