Technical Analysis of UNIY 2024-05-10
Overview:
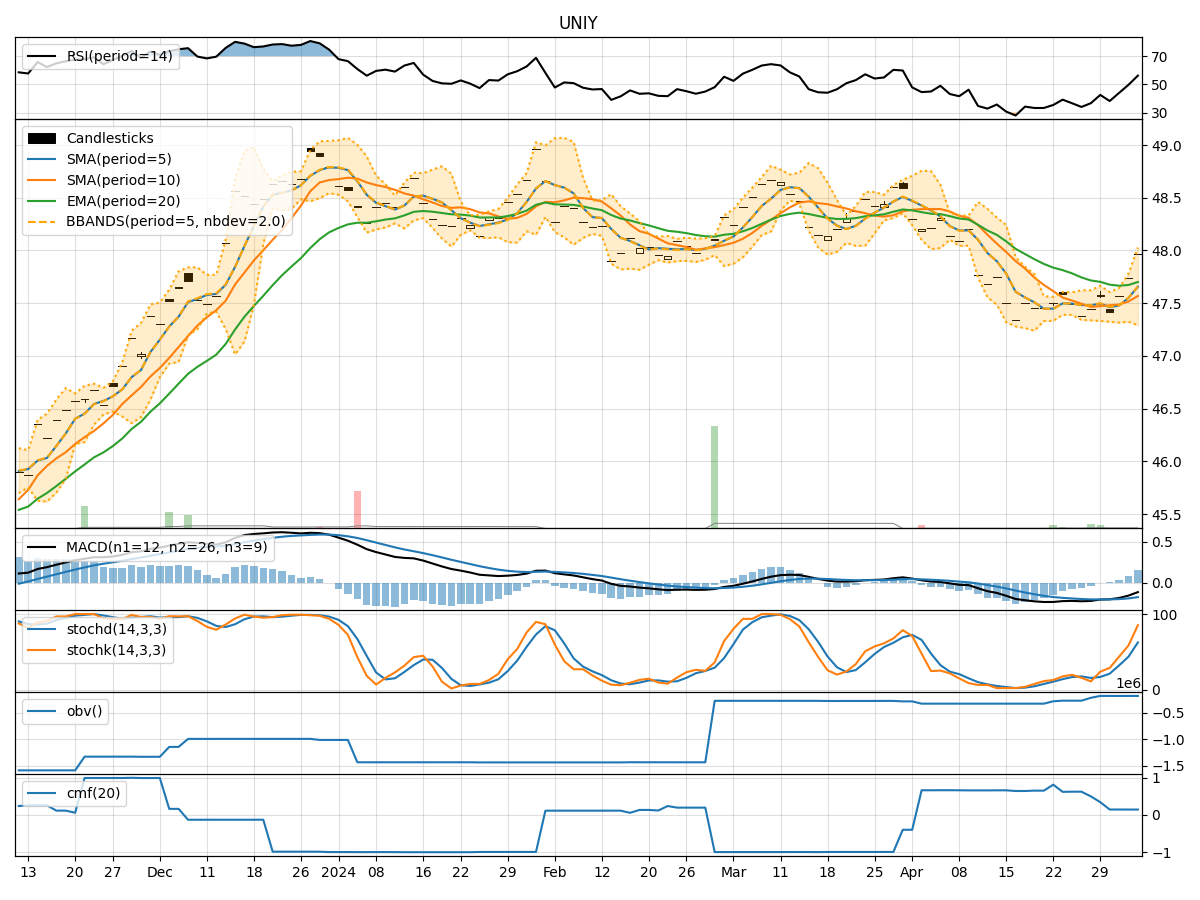
In analyzing the technical indicators for UNIY stock over the last 5 days, we will delve into the trend, momentum, volatility, and volume indicators to provide a comprehensive outlook on the possible stock price movement in the coming days. By examining these key indicators, we aim to offer valuable insights and predictions for potential investors.
Trend Analysis:
- Moving Averages (MA): The 5-day Moving Average (MA) has been consistently above the Simple Moving Average (SMA) and Exponential Moving Average (EMA), indicating a short-term uptrend.
- MACD: The MACD line has been positive, suggesting bullish momentum in the stock price.
- MACD Histogram: The MACD Histogram has been increasing, indicating strengthening bullish momentum.
Key Observation: The trend indicators suggest a bullish outlook for UNIY stock in the short term.
Momentum Analysis:
- RSI: The Relative Strength Index (RSI) has been fluctuating around the 50 level, indicating neutral momentum.
- Stochastic Oscillator: Both %K and %D have been in the overbought zone, suggesting potential for a reversal.
- Williams %R: The Williams %R is in the oversold territory, indicating a possible buying opportunity.
Key Observation: The momentum indicators show a mixed signal, with a slight bias towards a bearish reversal.
Volatility Analysis:
- Bollinger Bands (BB): The stock price has been trading within the Bollinger Bands, with the bands narrowing, indicating decreasing volatility.
- Bollinger %B: The %B indicator is hovering around the middle, suggesting a balanced market sentiment.
Key Observation: Volatility indicators point towards a sideways movement with a potential for a breakout in either direction.
Volume Analysis:
- On-Balance Volume (OBV): The OBV has been relatively stable, indicating consistent buying pressure.
- Chaikin Money Flow (CMF): The CMF has been positive, reflecting a healthy inflow of money into the stock.
Key Observation: Volume indicators suggest positive sentiment among investors, supporting the bullish trend.
Conclusion:
Based on the analysis of trend, momentum, volatility, and volume indicators, the overall outlook for UNIY stock in the next few days is bullish with a potential for sideways consolidation in the short term. Investors should consider the strong trend signals and positive volume indicators while being cautious of the mixed momentum signals that hint at a possible reversal. It is advisable to monitor the stock closely for any breakout opportunities and adjust trading strategies accordingly.
In summary, the next few days for UNIY stock are likely to see an upward movement with a possibility of consolidation, supported by bullish trend and volume indicators.