Technical Analysis of UNG 2024-05-03
Overview:
In analyzing the technical indicators for UNG over the last 5 days, we will delve into the trend, momentum, volatility, and volume indicators to provide a comprehensive outlook on the possible stock price movement in the coming days.
Trend Analysis:
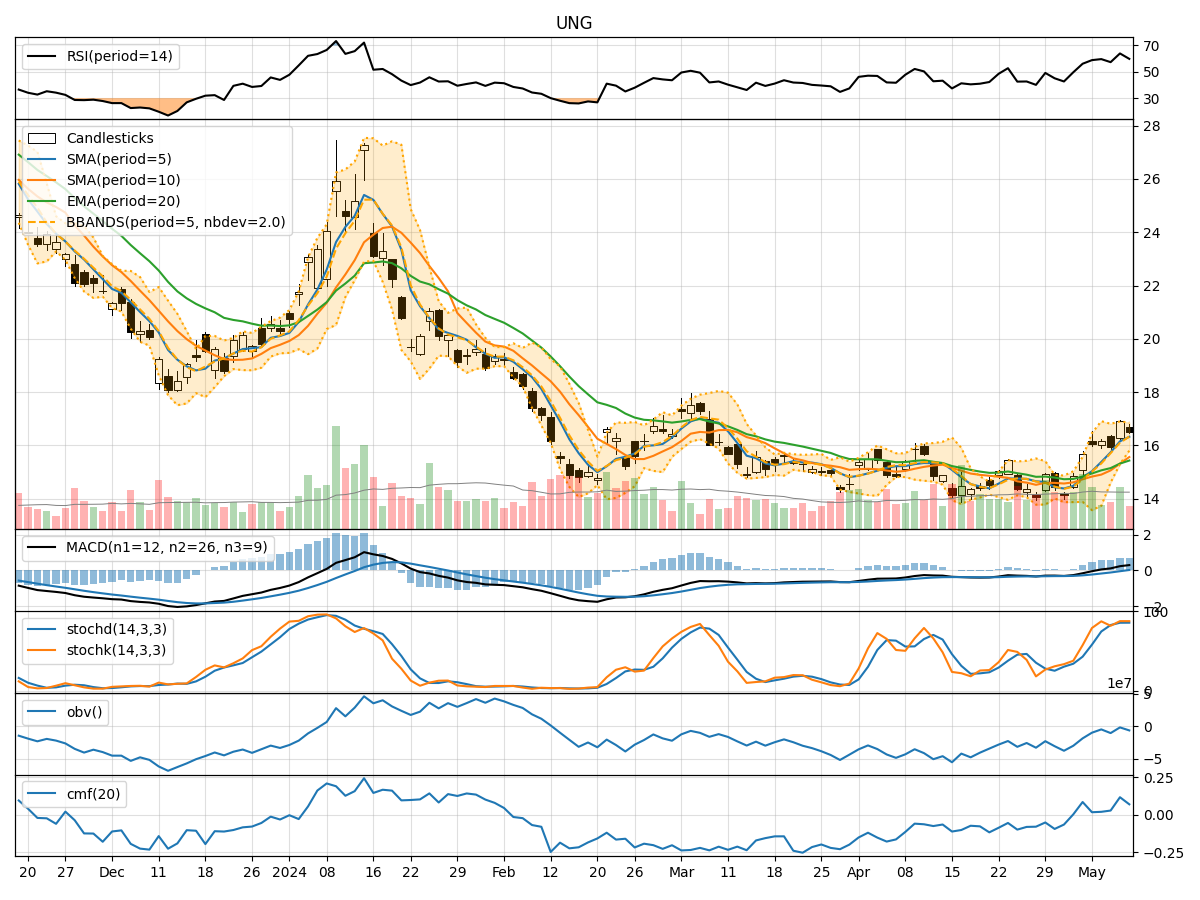
- Moving Averages (MA): The 5-day Moving Average (MA) has been fluctuating around the closing prices, indicating short-term price trends. The Simple Moving Average (SMA) and Exponential Moving Average (EMA) show a mixed trend, with the EMA slightly declining.
- MACD: The Moving Average Convergence Divergence (MACD) has been negative, suggesting a bearish momentum in the short term.
Momentum Analysis:
- RSI: The Relative Strength Index (RSI) has been hovering around the mid-level, indicating a neutral stance in momentum.
- Stochastic Oscillator: Both %K and %D have been rising, showing a potential bullish momentum.
- Williams %R: The Williams %R is near oversold levels, suggesting a possible buying opportunity.
Volatility Analysis:
- Bollinger Bands (BB): The Bollinger Bands have been narrowing, indicating decreasing volatility in the stock price.
Volume Analysis:
- On-Balance Volume (OBV): The OBV has been fluctuating, indicating indecision among investors.
- Chaikin Money Flow (CMF): The CMF has been negative, signaling potential selling pressure.
Key Observations:
- The trend indicators show a mixed picture with a slightly bearish bias.
- Momentum indicators suggest a neutral to slightly bullish momentum.
- Volatility has been decreasing, indicating a potential consolidation phase.
- Volume indicators reflect indecision among market participants.
Conclusion:
Based on the analysis of the technical indicators, the next few days' possible stock price movement for UNG is likely to be sideways with a slight bullish bias. Investors should closely monitor the momentum indicators for any potential shifts in sentiment. Additionally, keeping an eye on key support and resistance levels identified through trend analysis will be crucial in determining the stock's future direction.