Technical Analysis of ULE 2024-05-10
Overview:
In analyzing the technical indicators for ULE stock over the last 5 days, we will delve into the trend, momentum, volatility, and volume indicators to provide a comprehensive outlook on the possible stock price movement in the coming days.
Trend Analysis:
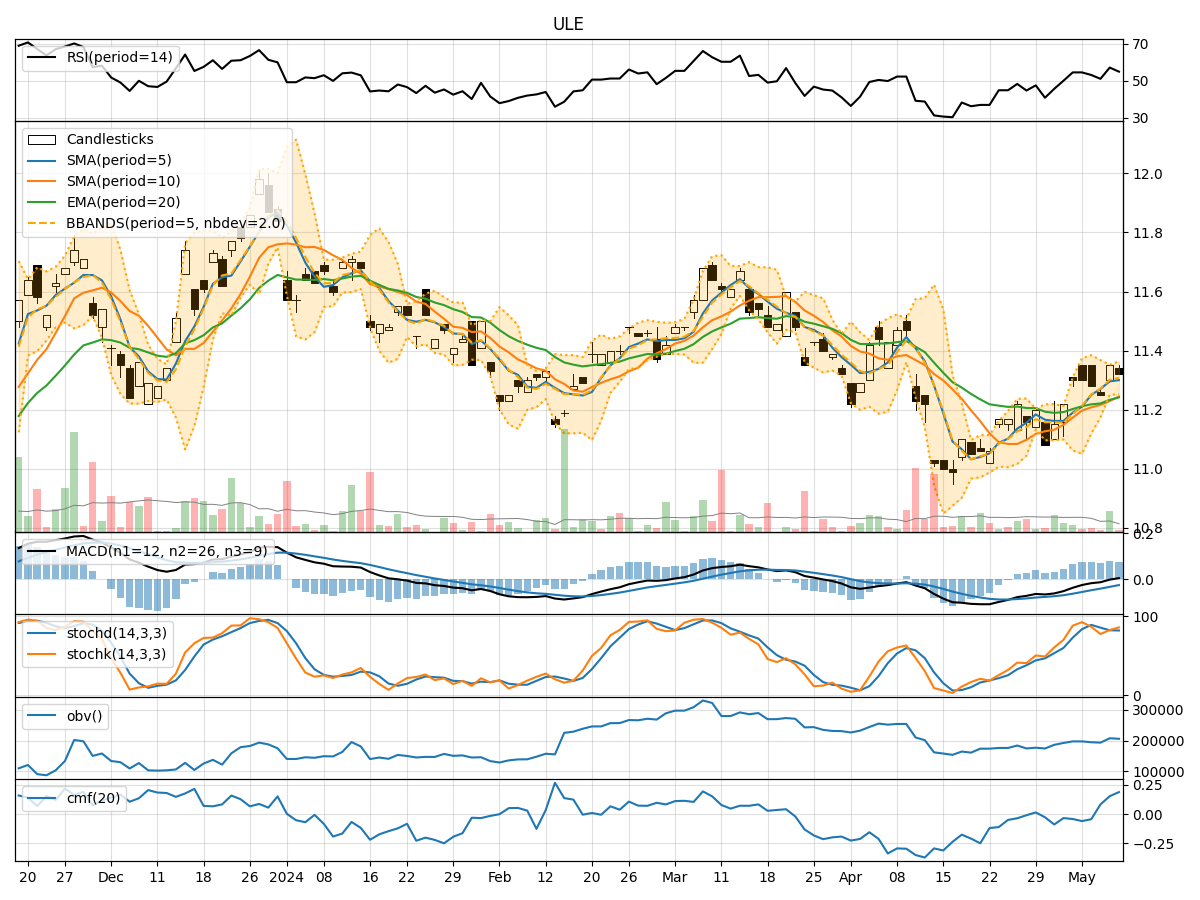
- Moving Averages (MA): The 5-day Moving Average (MA) has been showing a slight uptrend, indicating a positive momentum in the short term.
- MACD: The MACD line has been consistently above the signal line, suggesting a bullish trend.
- EMA: The Exponential Moving Average (EMA) has been steadily increasing, supporting the bullish sentiment.
Momentum Analysis:
- RSI: The Relative Strength Index (RSI) has been fluctuating around the neutral zone, indicating indecision in the market.
- Stochastic Oscillator: Both %K and %D have been in the overbought territory, signaling a potential reversal.
- Williams %R: The Williams %R is hovering near oversold levels, suggesting a possible buying opportunity.
Volatility Analysis:
- Bollinger Bands: The stock price has been trading within the Bollinger Bands, indicating a period of consolidation.
- Bollinger %B: The %B indicator is around the middle range, reflecting a balanced market sentiment.
Volume Analysis:
- On-Balance Volume (OBV): The OBV has been showing a slight increase, suggesting accumulation by investors.
- Chaikin Money Flow (CMF): The CMF has been positive, indicating buying pressure in the market.
Key Observations:
- The trend indicators suggest a bullish sentiment in the short term.
- Momentum indicators show mixed signals with a potential for a reversal.
- Volatility indicators point towards a period of consolidation.
- Volume indicators indicate a positive accumulation by investors.
Conclusion:
Based on the analysis of the technical indicators, the next few days for ULE stock are likely to see sideways movement with a slight upward bias. Traders should exercise caution as there are mixed signals from the momentum indicators, indicating a possible reversal in the short term. However, the overall trend remains bullish, supported by the moving averages and MACD. Investors may consider holding their positions with a close eye on key support and resistance levels for potential trading opportunities.