Technical Analysis of TUSI 2024-05-10
Overview:
In analyzing the technical indicators for TUSI stock over the last 5 days, we will delve into the trends, momentum, volatility, and volume indicators to provide a comprehensive outlook on the possible future stock price movement. By examining these key aspects, we aim to offer valuable insights and recommendations for potential investors.
Trend Indicators:
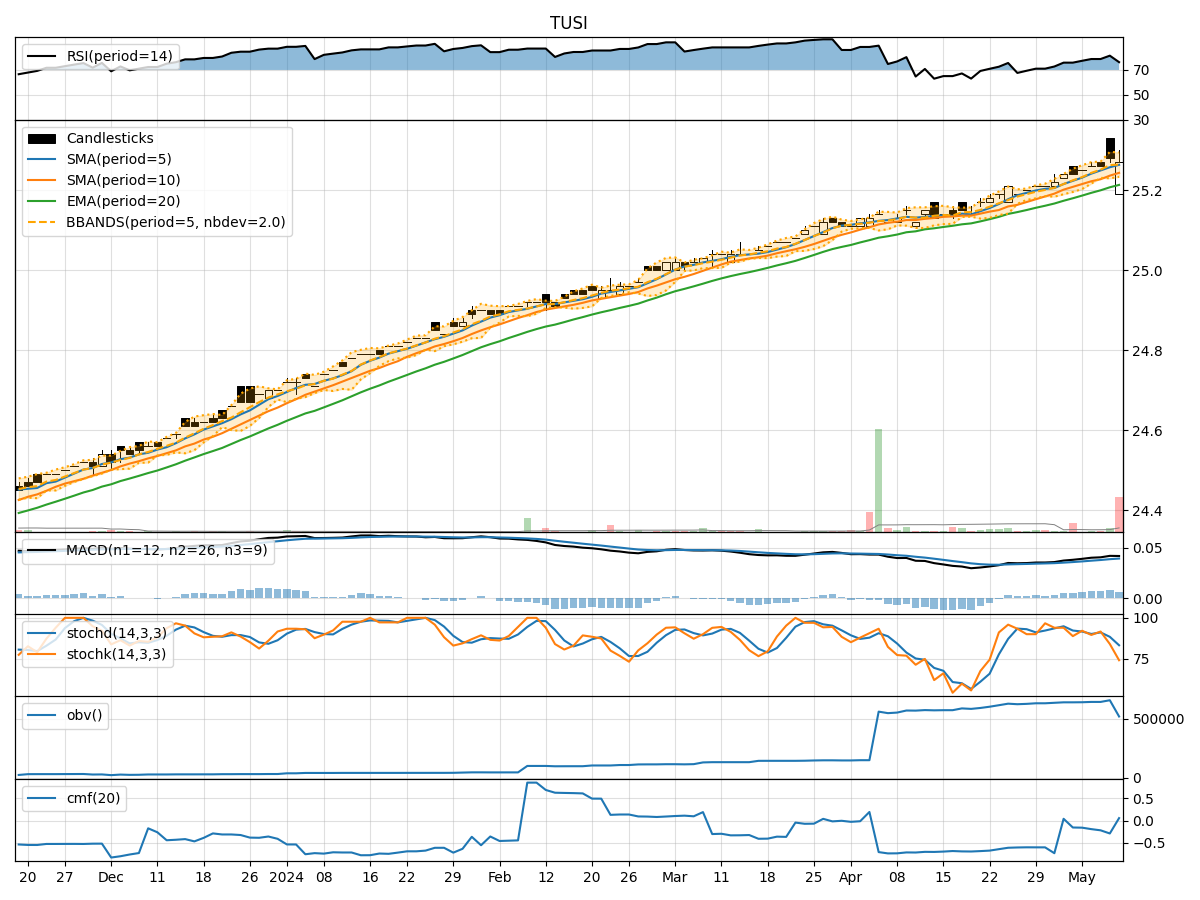
- Moving Averages (MA): The 5-day moving average has been consistently above the simple moving average (SMA) and exponential moving average (EMA), indicating a short-term bullish trend.
- MACD: The MACD line has been positive and above the signal line, suggesting upward momentum in the stock price.
- MACD Histogram: The MACD histogram has shown an increasing trend, indicating strengthening bullish momentum.
Momentum Indicators:
- RSI: The Relative Strength Index (RSI) has been in the overbought territory, suggesting a potential reversal or consolidation phase.
- Stochastic Oscillator: Both %K and %D have been decreasing, indicating a potential bearish momentum.
- Williams %R: The Williams %R has been in the oversold region, signaling a possible reversal in the stock price.
Volatility Indicators:
- Bollinger Bands: The stock price has been trading within the Bollinger Bands, with the bands narrowing, indicating reduced volatility.
- Bollinger %B: The %B indicator has been fluctuating around the midline, suggesting a period of consolidation.
Volume Indicators:
- On-Balance Volume (OBV): The OBV has shown mixed signals, with no clear trend in volume accumulation or distribution.
- Chaikin Money Flow (CMF): The CMF has been negative, indicating selling pressure in the stock.
Key Observations and Opinions:
- Trend: The stock is currently in an upward trend based on moving averages and MACD analysis.
- Momentum: The momentum indicators suggest a mixed outlook, with RSI in overbought territory and stochastic indicators showing bearish signals.
- Volatility: Volatility has been decreasing, indicating a potential period of consolidation.
- Volume: Volume indicators are inconclusive, with no clear trend in accumulation or distribution.
Conclusion:
Based on the analysis of the technical indicators, the next few days for TUSI stock could see sideways movement or a slight pullback. The bullish trend indicated by moving averages and MACD may face resistance due to overbought conditions highlighted by the RSI. The decreasing momentum and mixed volume signals further support a potential consolidation phase. Investors should closely monitor key support and resistance levels for potential entry or exit points.
Recommendation:
Given the mixed signals from the technical indicators, it is advisable for investors to exercise caution and wait for more clarity in the price action. Consider setting tight stop-loss levels to manage risk effectively. Additionally, monitoring key technical levels and market developments will be crucial in making informed trading decisions.