Technical Analysis of TIP 2024-05-10
Overview:
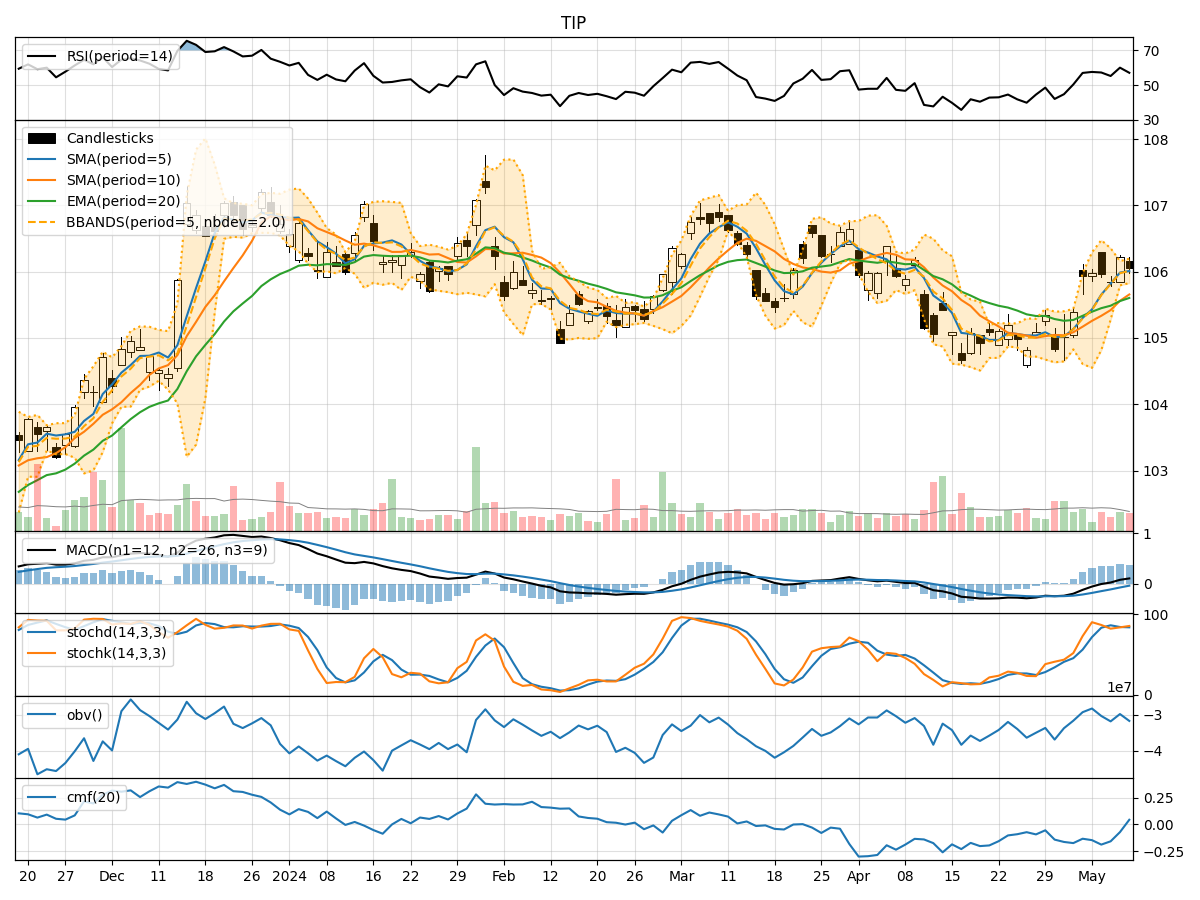
In analyzing the technical indicators for TIP stock over the last 5 days, we will delve into the trend, momentum, volatility, and volume indicators to provide a comprehensive outlook on the possible stock price movement in the coming days. By examining these key indicators, we aim to offer valuable insights and predictions for informed decision-making.
Trend Analysis:
- Moving Averages (MA): The 5-day Moving Average (MA) has been showing an upward trend, indicating a positive momentum in the stock price.
- MACD: The Moving Average Convergence Divergence (MACD) has been consistently positive, suggesting bullish momentum in the stock.
- EMA: The Exponential Moving Average (EMA) has been trending upwards, supporting the bullish sentiment in the stock.
Momentum Analysis:
- RSI: The Relative Strength Index (RSI) has been fluctuating around the neutral zone, indicating a balanced momentum in the stock.
- Stochastic Oscillator: The Stochastic Oscillator shows that the stock is neither overbought nor oversold, reflecting a stable momentum.
- Williams %R: The Williams %R indicator suggests that the stock is not in the extreme overbought or oversold territory.
Volatility Analysis:
- Bollinger Bands: The Bollinger Bands are relatively narrow, indicating low volatility in the stock price movement.
- Bollinger %B: The %B indicator is hovering around the midpoint, suggesting a balanced volatility level in the stock.
Volume Analysis:
- On-Balance Volume (OBV): The OBV indicator has been fluctuating, reflecting mixed sentiment among investors regarding the stock.
- Chaikin Money Flow (CMF): The CMF indicator is negative, indicating a slight outflow of money from the stock.
Key Observations:
- The trend indicators suggest a bullish sentiment in the stock, supported by positive moving averages and MACD.
- Momentum indicators show a neutral stance with no extreme overbought or oversold conditions.
- Volatility remains low, indicating a stable price movement with balanced fluctuations.
- Volume indicators reflect mixed sentiment among investors, with a slight outflow of money from the stock.
Conclusion:
Based on the analysis of the technical indicators, the stock is likely to continue its upward trend in the coming days. The bullish sentiment supported by the trend indicators and MACD, coupled with stable momentum and low volatility, indicates a positive outlook for TIP stock. Investors can consider buying or holding positions in the stock for potential gains in the near term.