Technical Analysis of THD 2024-05-10
Overview:
In analyzing the technical indicators for THD over the last 5 days, we will delve into the trend, momentum, volatility, and volume indicators to provide a comprehensive outlook on the possible stock price movement in the coming days. By examining these key indicators, we aim to offer valuable insights and predictions for informed decision-making.
Trend Analysis:
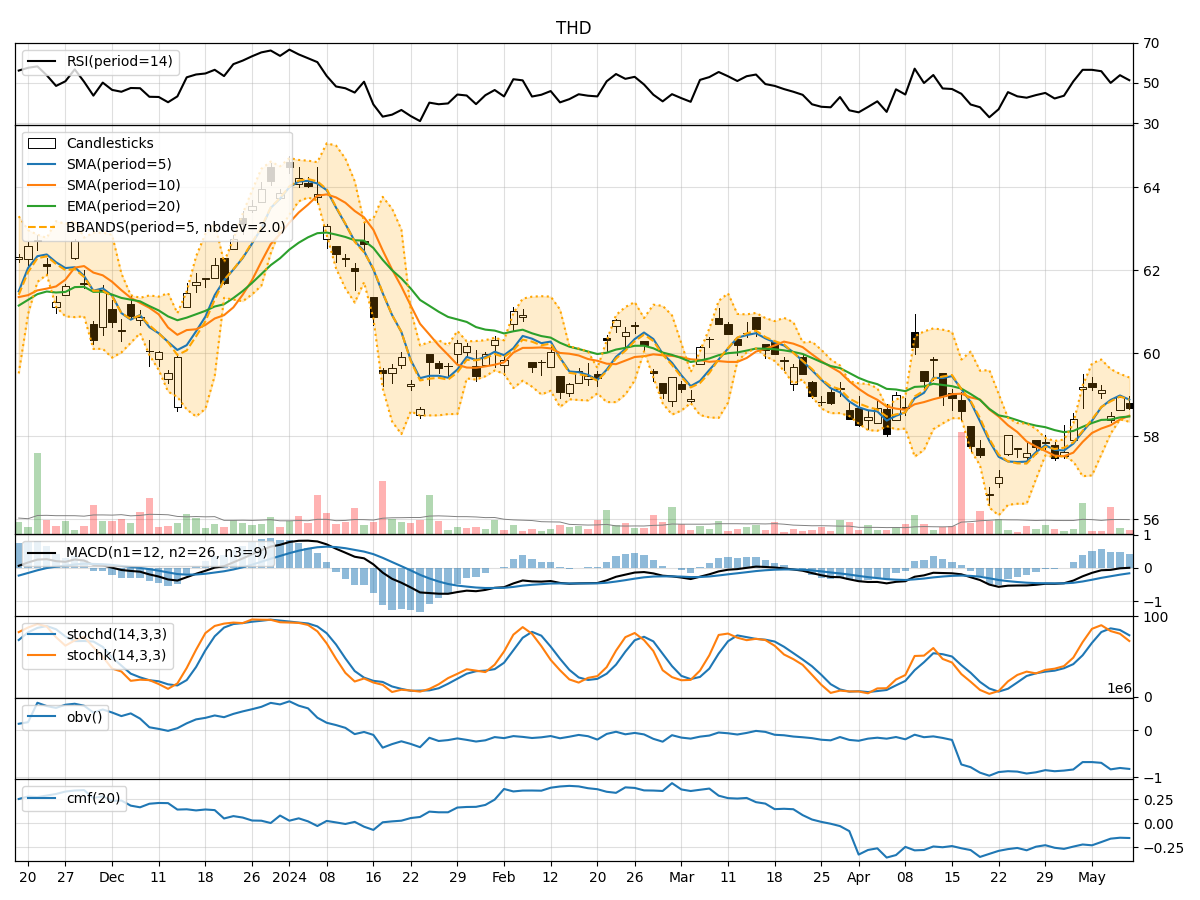
- Moving Averages (MA): The 5-day Moving Average (MA) has been fluctuating around the closing prices, indicating short-term price trends. The Simple Moving Average (SMA) and Exponential Moving Average (EMA) have shown slight variations but have generally been close to each other.
- MACD: The Moving Average Convergence Divergence (MACD) has been hovering around the zero line, suggesting a balance between bullish and bearish momentum.
- Conclusion: The trend indicators suggest a sideways movement in the stock price.
Momentum Analysis:
- RSI: The Relative Strength Index (RSI) has been oscillating within the neutral range, indicating a lack of strong buying or selling pressure.
- Stochastic Oscillator: Both %K and %D have been fluctuating, but not in extreme overbought or oversold territories.
- Conclusion: The momentum indicators imply a neutral stance in the stock's momentum.
Volatility Analysis:
- Bollinger Bands (BB): The Bollinger Bands have been narrowing, indicating decreasing volatility in the stock price.
- Conclusion: The volatility indicators suggest a decreasing volatility environment.
Volume Analysis:
- On-Balance Volume (OBV): The OBV has been showing a slight decline, indicating some distribution happening in the stock.
- Chaikin Money Flow (CMF): The CMF has been negative, suggesting outflow of money from the stock.
- Conclusion: The volume indicators point towards a bearish sentiment in terms of volume flow.
Overall Conclusion:
Based on the analysis of trend, momentum, volatility, and volume indicators, the next few days' possible stock price movement for THD is likely to be sideways with a bearish bias. The trend indicators show a lack of clear direction, while momentum remains neutral. Volatility is decreasing, indicating a potential consolidation phase, and volume indicators suggest a bearish sentiment.
Key Recommendations:
- Monitor Closely: Keep a close eye on any significant developments or news that could potentially impact the stock price.
- Risk Management: Implement proper risk management strategies to protect against potential downside risks.
- Wait for Confirmation: Consider waiting for clearer signals or confirmation from the indicators before making significant trading decisions.
In conclusion, while the technical indicators point towards a sideways movement with a bearish bias, it is essential to exercise caution and stay vigilant in monitoring the stock's performance to make well-informed decisions.