Technical Analysis of TDIV 2024-05-10
Overview:
In analyzing the technical indicators for TDIV over the last 5 days, we will delve into the trend, momentum, volatility, and volume indicators to provide a comprehensive outlook on the possible stock price movement in the coming days. By examining these key indicators, we aim to offer valuable insights and recommendations for potential investors.
Trend Analysis:
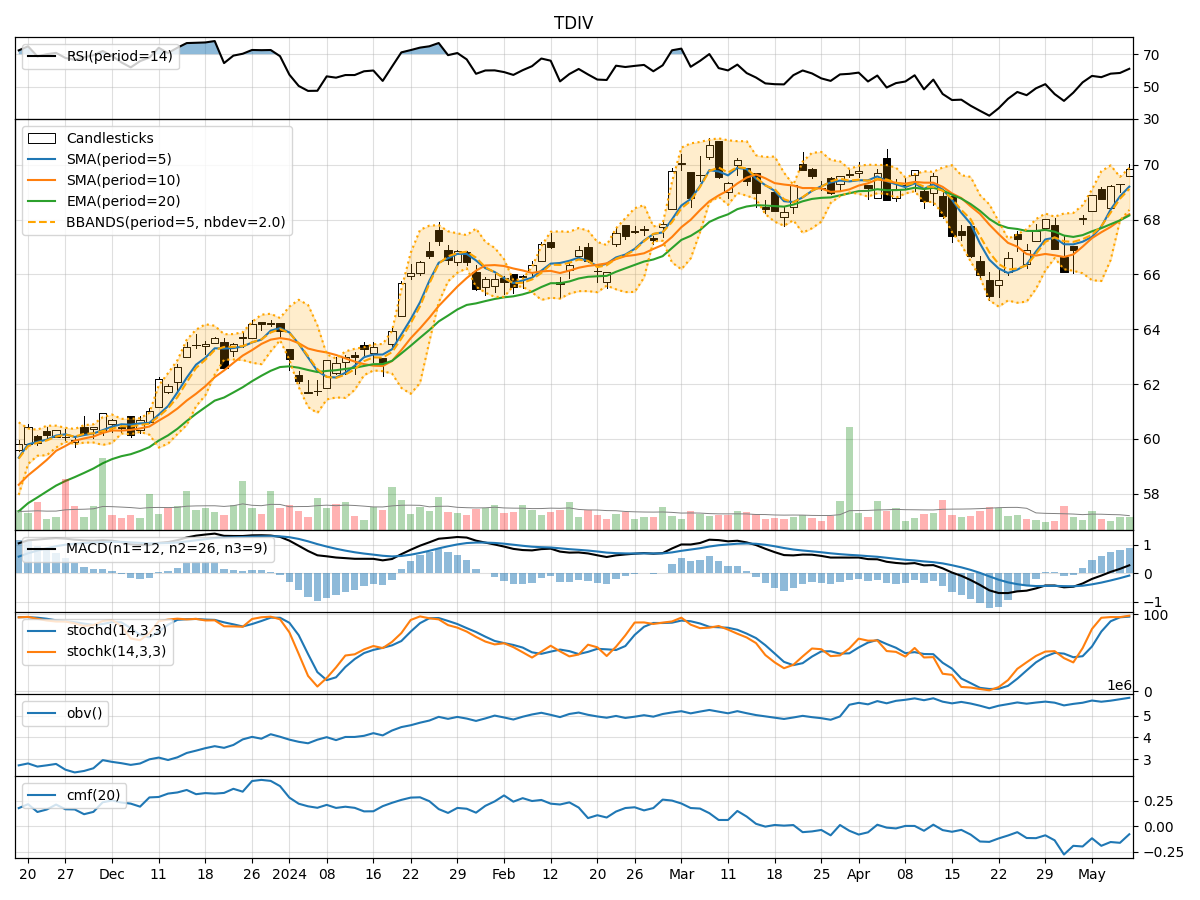
- Moving Averages (MA): The 5-day Moving Average has been consistently rising, indicating a bullish trend in the short term.
- MACD: The MACD line has been above the signal line for the past 5 days, suggesting a bullish momentum.
- RSI: The Relative Strength Index has been trending upwards, indicating increasing buying pressure.
Momentum Analysis:
- Stochastic Oscillator: Both %K and %D have been in the overbought zone, suggesting a potential reversal or consolidation.
- Williams %R: The Williams %R has been fluctuating but generally in the oversold territory, indicating a possible buying opportunity.
Volatility Analysis:
- Bollinger Bands: The stock price has been trading within the upper Bollinger Band, indicating an overbought condition.
- Volatility Bands: The volatility has been relatively stable, with the bands not showing significant expansion or contraction.
Volume Analysis:
- On-Balance Volume (OBV): The OBV has been increasing, suggesting accumulation by investors.
- Chaikin Money Flow (CMF): The CMF has been negative, indicating selling pressure in the market.
Key Observations:
- The trend indicators suggest a bullish sentiment in the short term.
- Momentum indicators show signs of potential overbought conditions.
- Volatility remains relatively stable with no significant price swings.
- Volume indicators indicate mixed signals with OBV rising but CMF showing selling pressure.
Conclusion:
Based on the analysis of the technical indicators, the next few days' possible stock price movement for TDIV is likely to experience consolidation or a minor pullback due to the overbought conditions indicated by the momentum indicators. However, the overall trend remains bullish in the short term, supported by the moving averages and MACD. Investors should closely monitor the stochastic oscillator for potential reversal signals and consider the OBV for confirmation of buying interest. It is advisable to exercise caution and wait for clearer signals before making significant trading decisions.