Technical Analysis of TBLL 2024-05-10
Overview:
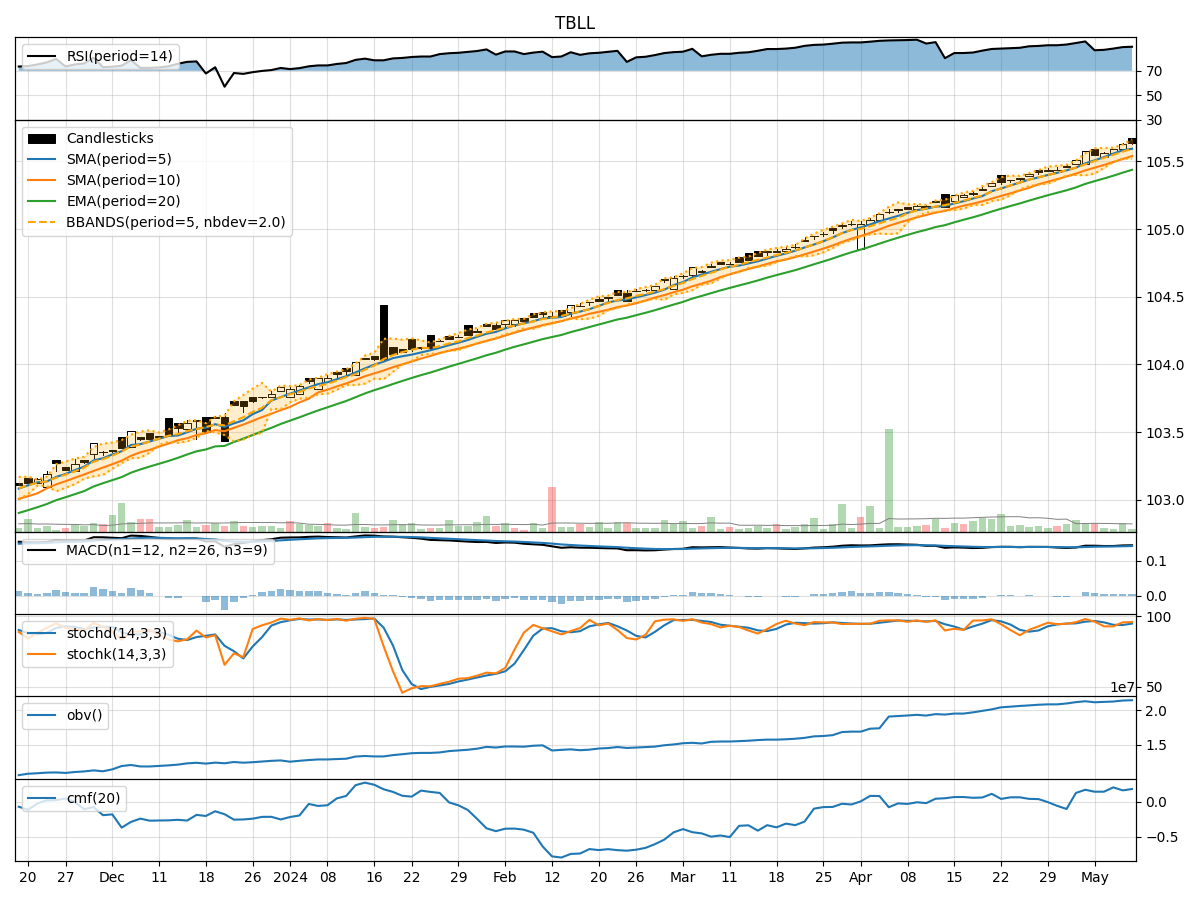
In analyzing the technical indicators for TBLL stock over the last 5 days, we will delve into the trend, momentum, volatility, and volume indicators to provide a comprehensive outlook on the possible future stock price movement. By examining these key indicators, we aim to offer valuable insights and predictions for the upcoming trading days.
Trend Indicators:
- Moving Averages (MA): The 5-day MA has been consistently above the closing price, indicating a bullish trend.
- MACD: The MACD line has been positive and increasing, suggesting upward momentum.
- EMA: The EMA has been steadily rising, supporting the bullish trend.
Key Observation: The trend indicators point towards a bullish sentiment in the stock price movement.
Momentum Indicators:
- RSI: The RSI has been in the overbought territory, indicating strong buying momentum.
- Stochastic Oscillator: Both %K and %D have been in the overbought zone, signaling potential for a pullback.
- Williams %R: The indicator has been in the oversold region, suggesting a possible reversal.
Key Observation: Momentum indicators show a mixed signal with potential for a short-term correction.
Volatility Indicators:
- Bollinger Bands (BB): The stock price has been trading within the bands, indicating normal volatility.
- Bollinger %B: The %B has fluctuated within the bands, reflecting typical price movement.
Key Observation: Volatility indicators suggest stable price movement within the bands.
Volume Indicators:
- On-Balance Volume (OBV): The OBV has shown a slight increase, indicating accumulation.
- Chaikin Money Flow (CMF): The CMF has been positive, signaling buying pressure.
Key Observation: Volume indicators support the bullish sentiment in the stock.
Conclusion:
Based on the analysis of trend, momentum, volatility, and volume indicators, the next few days' possible stock price movement for TBLL is likely to be upward with a potential for a short-term correction due to overbought conditions in momentum indicators. The overall trend remains bullish, supported by positive volume and volatility indicators. Traders should consider potential pullbacks as opportunities to enter long positions in alignment with the prevailing uptrend.
Key Recommendations:
- Consider buying on dips: Utilize short-term corrections to enter long positions.
- Monitor momentum indicators: Watch for signs of a reversal or continuation of the bullish trend.
- Set stop-loss levels: Protect profits and manage risk effectively.
- Stay informed: Keep track of news and events that may impact the stock price.
By combining technical analysis with market insights, traders can make informed decisions and capitalize on the potential price movements in TBLL stock.