Technical Analysis of TBIL 2024-05-10
Overview:
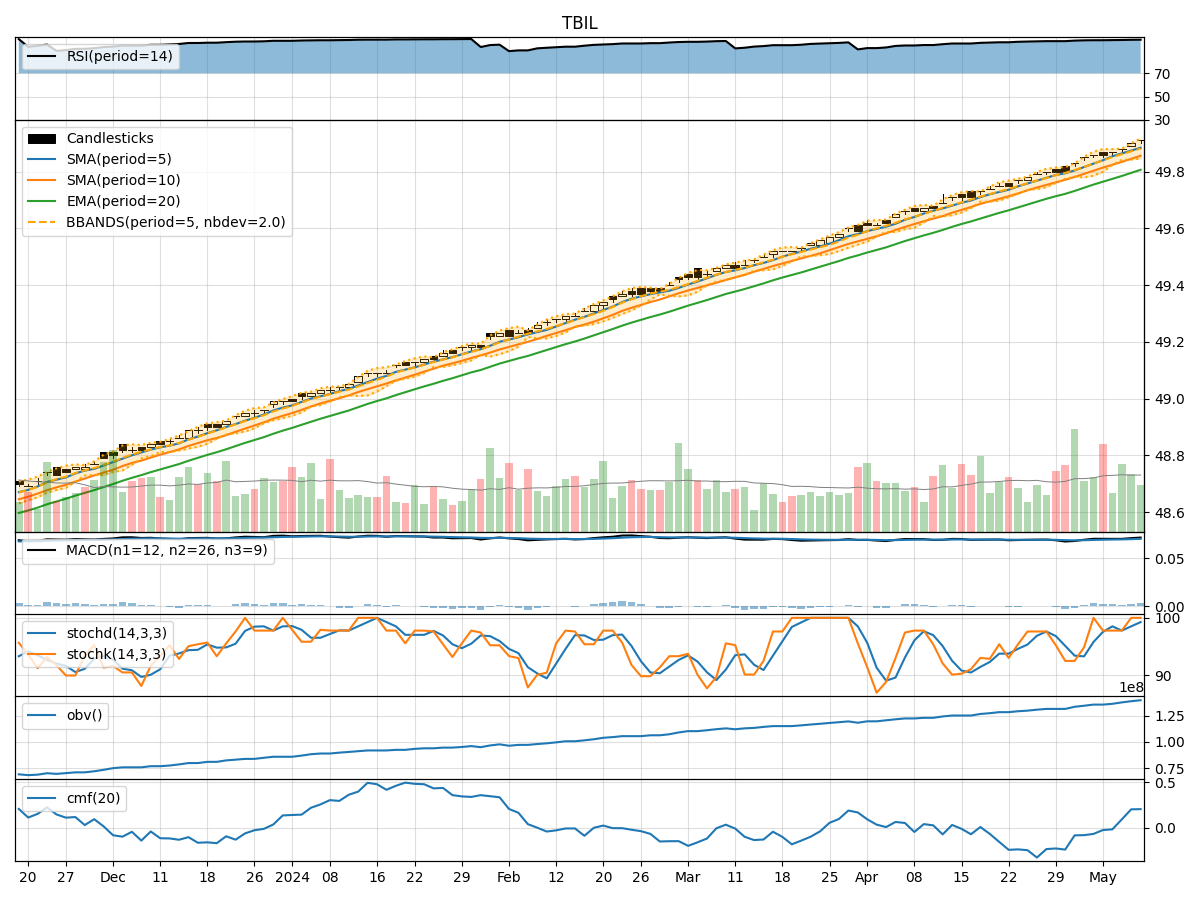
In analyzing the technical indicators for TBIL stock over the last 5 days, we will delve into the trend, momentum, volatility, and volume indicators to provide a comprehensive outlook on the possible stock price movement in the coming days.
Trend Analysis:
- Moving Averages (MA): The 5-day MA has been consistently above the closing prices, indicating a bullish trend.
- MACD: The MACD line has been positive and increasing, suggesting upward momentum.
- EMA: The EMA has been steadily rising, supporting the bullish trend.
Key Observation: The trend indicators point towards a strong bullish sentiment in the stock.
Momentum Analysis:
- RSI: The RSI has been consistently high, indicating overbought conditions but also strong momentum.
- Stochastic Oscillator: Both %K and %D have been in the overbought zone, suggesting a strong upward momentum.
- Williams %R: The indicator has been consistently at or near the oversold level, indicating strong buying pressure.
Key Observation: Momentum indicators reflect a strong bullish sentiment with potential for further upside.
Volatility Analysis:
- Bollinger Bands (BB): The bands have been widening, indicating increased volatility.
- Bollinger %B: The %B has been fluctuating within a range, suggesting potential price swings.
- Bollinger Band Width: The band width has been expanding, indicating heightened volatility.
Key Observation: Volatility indicators suggest an increase in price volatility which could lead to significant price movements.
Volume Analysis:
- On-Balance Volume (OBV): The OBV has been steadily increasing, indicating strong buying pressure.
- Chaikin Money Flow (CMF): The CMF has been positive, signaling accumulation of the stock.
Key Observation: Volume indicators support the bullish sentiment with increasing buying interest.
Conclusion:
Based on the analysis of trend, momentum, volatility, and volume indicators, the overall outlook for TBIL stock is strongly bullish. The trend is positive, momentum is robust, volatility is increasing, and volume is supportive of further price appreciation.
Forecast:
Given the current technical indicators and market dynamics, the next few days are likely to see a continuation of the bullish trend in TBIL stock. Traders and investors may consider buying opportunities on pullbacks to capitalize on the upward momentum.
Disclaimer:
Remember that while technical analysis provides valuable insights, it is essential to consider other fundamental factors and risk management strategies in your investment decisions. Always conduct thorough research and consult with financial advisors before making any trading or investment choices.