Technical Analysis of TAN 2024-05-10
Overview:
In analyzing the technical indicators for TAN over the last 5 days, we will delve into the trend, momentum, volatility, and volume indicators to provide a comprehensive outlook on the possible stock price movement in the coming days. By examining these key aspects, we aim to offer valuable insights and recommendations for potential investors.
Trend Analysis:
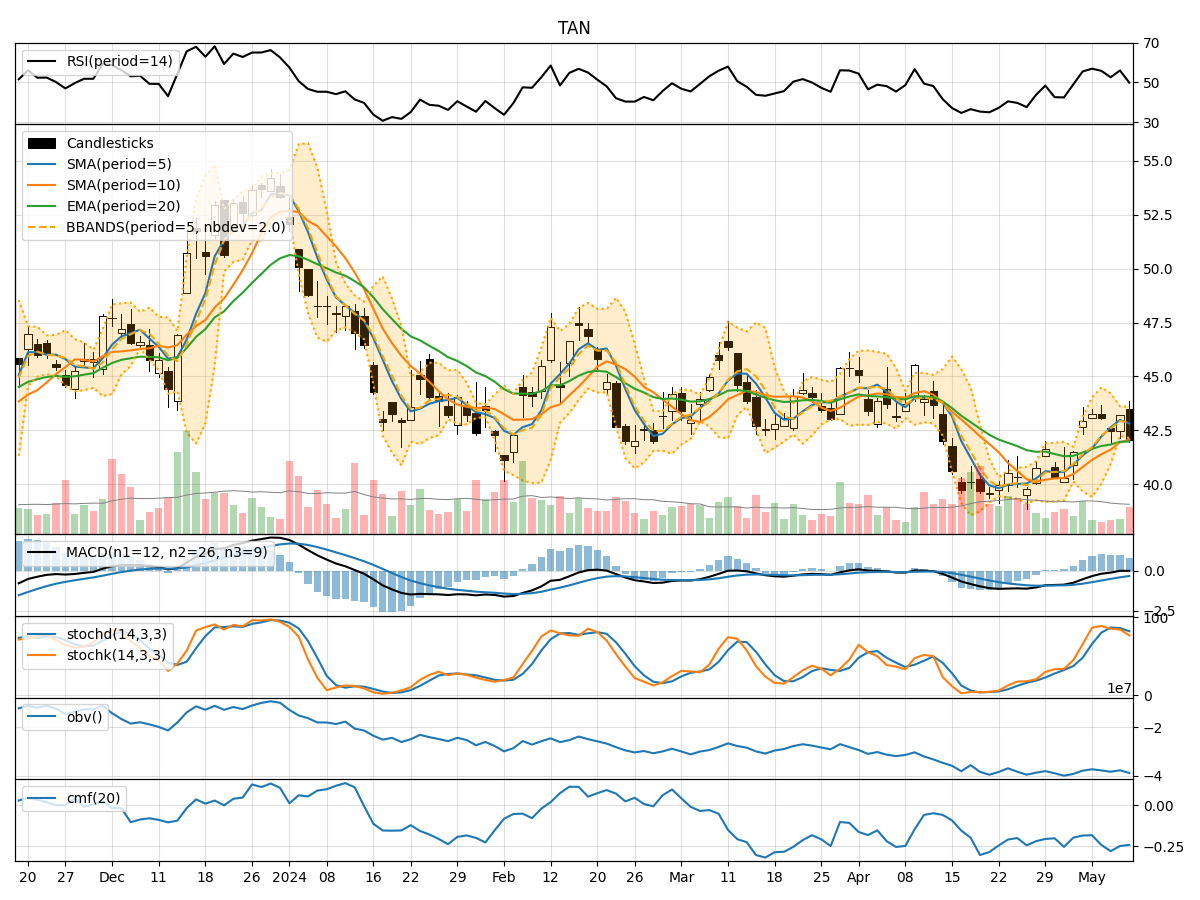
- Moving Averages (MA): The 5-day Moving Average (MA) has been fluctuating around the closing prices, indicating short-term price trends. The Simple Moving Average (SMA) and Exponential Moving Average (EMA) show a slight uptrend, suggesting a potential bullish sentiment.
- MACD: The Moving Average Convergence Divergence (MACD) has been positive but decreasing, indicating a possible weakening of the bullish momentum.
- Conclusion: The trend indicators suggest a mild bullish sentiment in the short term.
Momentum Analysis:
- RSI: The Relative Strength Index (RSI) has been oscillating around the overbought territory, indicating a strong buying pressure.
- Stochastic Oscillator: Both %K and %D have been relatively high, suggesting an overbought condition.
- Conclusion: The momentum indicators point towards a potential correction or consolidation due to the overbought conditions.
Volatility Analysis:
- Bollinger Bands (BB): The Bollinger Bands have been narrowing, indicating decreasing volatility and a potential price breakout.
- Conclusion: The volatility indicators suggest a potential price breakout in the near future.
Volume Analysis:
- On-Balance Volume (OBV): The OBV has been fluctuating negatively, indicating distribution and selling pressure.
- Chaikin Money Flow (CMF): The CMF has been negative, suggesting a lack of buying interest.
- Conclusion: The volume indicators reflect bearish sentiment with selling pressure dominating.
Conclusion:
Based on the analysis of the technical indicators, the next few days' possible stock price movement for TAN is likely to experience a correction or consolidation in the short term. The trend indicators show a mild bullish sentiment, while the momentum indicators signal a potential correction due to overbought conditions. The volatility indicators point towards a potential price breakout, and the volume indicators reflect a bearish sentiment with selling pressure dominating. Therefore, it is advisable to exercise caution and closely monitor the price action for potential entry or exit points.
Key Recommendations:
- Monitor Price Action: Keep a close eye on the price movements for potential breakout or reversal signals.
- Risk Management: Implement proper risk management strategies to protect capital in case of adverse price movements.
- Confirmation: Wait for confirmation from multiple indicators before making trading decisions.
- Consultation: Consider seeking advice from financial advisors or experienced traders for additional insights.
In conclusion, while the technical analysis provides valuable insights, it is essential to consider other fundamental factors and market dynamics before making investment decisions. Stay informed, stay cautious, and stay proactive in your trading approach.